جميع الكتب

مهني

1 Markets I: The Ecosystem and Exchange-Traded Marketsالأسواق عبر الإنترنت 2 Markets II: Rates, FX and Creditالأسواق عبر الإنترنت 3 Markets III: Commodities, Energy and Cryptoالأسواق عبر الإنترنت 4 Quantitative Methodsالأساليب عبر الإنترنت 5 Derivatives and Volatilityالمشتقات عبر الإنترنت 6 Rates, Credit, XVA and Riskالفائدة والائتمان والمخاطر عبر الإنترنت 7 Research Craft: Predictors, Backtests, Measurement, Portfoliosالبحث عبر الإنترنت 8 Strategies I: Equities and Futuresالاستراتيجيات عبر الإنترنت 9 Strategies II: Volatility, Relative Value, Macro and the Bank Desksالاستراتيجيات عبر الإنترنت 10 Microstructure and Executionالتنفيذ عبر الإنترنت 11 Market Making and High-Frequency Tradingصناعة السوق عبر الإنترنت 12 Machine Learning for Marketsتعلم الآلة عبر الإنترنت 13 Low-Latency Softwareالتكنولوجيا عبر الإنترنت 14 Networks, Hardware and Trading Infrastructureالتكنولوجيا عبر الإنترنت 15 Research, Data and Risk Platformsالتكنولوجيا عبر الإنترنت 16 The Desk and the Firmالشركة عبر الإنترنت 17 The Industry: Firms, Roles and Careersالمسارات المهنية عبر الإنترنت 18 The Interview Bookالمسارات المهنية عبر الإنترنت
التطبيقات حول المدرب تسجيل الدخول ابدأ القراءة

Quantitative Finance · المسرد

ما معنى Index backtest decay؟

Definition 27.3 Strategies II: Volatility, Relative Value, Macro and the Bank Desks · الفصل 27 — Quantitative Investment Strategies

Index backtest decay is the fall from the Sharpe ratio of a strategy index’s pre-launch backtest to that of its live, after-fee returns, measured across launched indices.
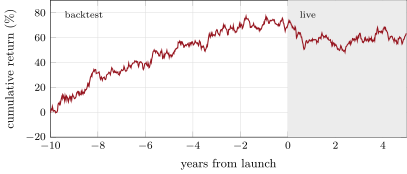
One synthetic product team’s best index: cumulative sum of daily returns at a 10% volatility target over its ten-year backtest and its first five live years after fees and leakage (shaded). Data: s2_qis.path.
Figure 27.1. One synthetic product team’s best index: cumulative sum of daily returns at a 10% volatility target over its ten-year backtest and its first five live years after fees and leakage (shaded). Data: s2_qis.path.
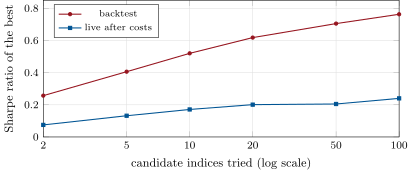
The best of N candidate indices: mean backtest Sharpe ratio and mean live Sharpe ratio after fees and leakage, over 2 000 synthetic product teams, against the number of candidates tried. Data: s2_qis.complexity.
Figure 27.2. The best of NN candidate indices: mean backtest Sharpe ratio and mean live Sharpe ratio after fees and leakage, over 2 000 synthetic product teams, against the number of candidates tried. Data: s2_qis.complexity.
اقرأ في الفصل →