
جميع الكتب

مهني

1 Markets I: The Ecosystem and Exchange-Traded Marketsالأسواق عبر الإنترنت 2 Markets II: Rates, FX and Creditالأسواق عبر الإنترنت 3 Markets III: Commodities, Energy and Cryptoالأسواق عبر الإنترنت 4 Quantitative Methodsالأساليب عبر الإنترنت 5 Derivatives and Volatilityالمشتقات عبر الإنترنت 6 Rates, Credit, XVA and Riskالفائدة والائتمان والمخاطر عبر الإنترنت 7 Research Craft: Predictors, Backtests, Measurement, Portfoliosالبحث عبر الإنترنت 8 Strategies I: Equities and Futuresالاستراتيجيات عبر الإنترنت 9 Strategies II: Volatility, Relative Value, Macro and the Bank Desksالاستراتيجيات عبر الإنترنت 10 Microstructure and Executionالتنفيذ عبر الإنترنت 11 Market Making and High-Frequency Tradingصناعة السوق عبر الإنترنت 12 Machine Learning for Marketsتعلم الآلة عبر الإنترنت 13 Low-Latency Softwareالتكنولوجيا عبر الإنترنت 14 Networks, Hardware and Trading Infrastructureالتكنولوجيا عبر الإنترنت 15 Research, Data and Risk Platformsالتكنولوجيا عبر الإنترنت 16 The Desk and the Firmالشركة عبر الإنترنت 17 The Industry: Firms, Roles and Careersالمسارات المهنية عبر الإنترنت 18 The Interview Bookالمسارات المهنية عبر الإنترنت
التطبيقات حول المدرب تسجيل الدخول ابدأ القراءة

Quantitative Finance · المسرد

ما معنى Level, slope and curvature factors؟

يُعرف أيضًا باسم: level factor · slope factor · curvature factor

Definition 3.7 Rates, Credit, XVA and Risk · الفصل 3 — Rates Risk

For a curve sampled at nn maturities, let v1,v2,v3v_1, v_2, v_3 be the first three eigenvectors of the covariance of its daily changes (with λ1≥λ2≥λ3\lambda_1\ge \lambda_2\ge\lambda_3). The level factor v1v_1 has loadings of one sign, the slope factor v2v_2 changes sign once, from short to long maturities, and the curvature factor v3v_3 changes sign twice. The move of day tt has score vi⊤δqtv_i^\top\delta q_t on factor ii, and the factors are uncorrelated by construction.
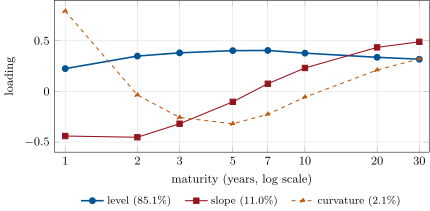
Loadings of the first three principal components of daily changes of US Treasury par yields, January 2016 to September 2026, with their shares of variance. Source: US Treasury, daily par yield curve rates (public domain); the chapter’s tutorial.
Figure 3.3. Loadings of the first three principal components of daily changes of US Treasury par yields, January 2016 to September 2026, with their shares of variance. Source: US Treasury, daily par yield curve rates (public domain); the chapter’s tutorial.

أمثلة

Example 3.8 (Ten years of Treasury moves)

Over the 2 681 daily changes of the US Treasury par curve from January 2016 to September 2026 (eight maturities from one to thirty years), the first three components explain 85.1%, 11.0% and 2.1% of the variance, 98.2% together, with daily standard deviations of 13.6, 4.9 and 2.1 basis points of score (Figure 3.3). The level loads less on the one-year than on the belly; the curvature factor is dominated by the one-year yield, the maturity most tied to the next policy meetings. Litterman and Scheinkman found the same three factors in 1991.

اقرأ في الفصل →