جميع الكتب

مهني

1 Markets I: The Ecosystem and Exchange-Traded Marketsالأسواق عبر الإنترنت 2 Markets II: Rates, FX and Creditالأسواق عبر الإنترنت 3 Markets III: Commodities, Energy and Cryptoالأسواق عبر الإنترنت 4 Quantitative Methodsالأساليب عبر الإنترنت 5 Derivatives and Volatilityالمشتقات عبر الإنترنت 6 Rates, Credit, XVA and Riskالفائدة والائتمان والمخاطر عبر الإنترنت 7 Research Craft: Predictors, Backtests, Measurement, Portfoliosالبحث عبر الإنترنت 8 Strategies I: Equities and Futuresالاستراتيجيات عبر الإنترنت 9 Strategies II: Volatility, Relative Value, Macro and the Bank Desksالاستراتيجيات عبر الإنترنت 10 Microstructure and Executionالتنفيذ عبر الإنترنت 11 Market Making and High-Frequency Tradingصناعة السوق عبر الإنترنت 12 Machine Learning for Marketsتعلم الآلة عبر الإنترنت 13 Low-Latency Softwareالتكنولوجيا عبر الإنترنت 14 Networks, Hardware and Trading Infrastructureالتكنولوجيا عبر الإنترنت 15 Research, Data and Risk Platformsالتكنولوجيا عبر الإنترنت 16 The Desk and the Firmالشركة عبر الإنترنت 17 The Industry: Firms, Roles and Careersالمسارات المهنية عبر الإنترنت 18 The Interview Bookالمسارات المهنية عبر الإنترنت
التطبيقات حول المدرب تسجيل الدخول ابدأ القراءة

Quantitative Finance · المسرد

ما معنى Leverage effect, GJR-GARCH model؟

يُعرف أيضًا باسم: leverage effect · GJR-GARCH model

Definition 18.5 Quantitative Methods · الفصل 18 — Volatility Models

The leverage effect is the tendency of volatility to rise more after falls than after rises of the same size, strong for equity indices. The GJR-GARCH model (Glosten, Jagannathan and Runkle, 1993) captures it with ht=ω+(α+γ1rt−1<0)rt−12+βht−1h_t = \omega + (\alpha + \gamma\mathbf 1_{r_{t-1} < 0})r_{t-1}^2 + \beta h_{t-1}; its persistence is α+β+γ/2\alpha + \beta + \gamma/2 for symmetric innovations.

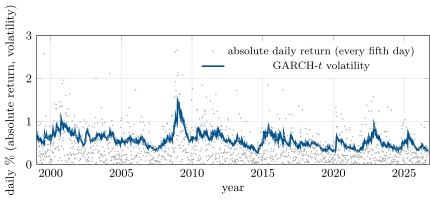
Daily EUR/USD absolute returns and the conditional volatility of the fitted GARCH(1,1) with Student-t innovations, 1999–2026. The clusters (2000, 2008–2009, 2011, 2015, 2022) are what the model’s persistence of 0.9984 describes. Data: ECB euro reference rates (source: ECB statistics).
Figure 18.1. Daily EUR/USD absolute returns and the conditional volatility of the fitted GARCH(1,1) with Student-tt innovations, 1999–2026. The clusters (2000, 2008–2009, 2011, 2015, 2022) are what the model’s persistence of 0.9984 describes. Data: ECB euro reference rates (source: ECB statistics).
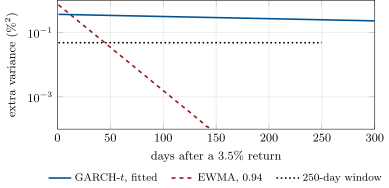
How long one 3.5% daily return stays in each variance forecast (the extra variance over a background of 0.5% days). GARCH lets it decay slowly (half-life 445 days), EWMA quickly (11 days), and the equally weighted window keeps it whole for 250 days and then drops it in one step. Data: the chapter’s tutorial, from the fitted parameters.
Figure 18.2. How long one 3.5% daily return stays in each variance forecast (the extra variance over a background of 0.5% days). GARCH lets it decay slowly (half-life 445 days), EWMA quickly (11 days), and the equally weighted window keeps it whole for 250 days and then drops it in one step. Data: the chapter’s tutorial, from the fitted parameters.
اقرأ في الفصل →