Tous les livres

Professionnel

Applis À propos Coach Connexion Commencer la lecture

Quantitative Finance · Glossaire

Qu'est-ce que « Leverage effect, GJR-GARCH model » ?

Aussi appelé : leverage effect · GJR-GARCH model

Definition 18.5 Quantitative Methods · Chapitre 18 — Volatility Models

The leverage effect is the tendency of volatility to rise more after falls than after rises of the same size, strong for equity indices. The GJR-GARCH model (Glosten, Jagannathan and Runkle, 1993) captures it with ht=ω+(α+γ1rt−1<0)rt−12+βht−1h_t = \omega + (\alpha + \gamma\mathbf 1_{r_{t-1} < 0})r_{t-1}^2 + \beta h_{t-1}; its persistence is α+β+γ/2\alpha + \beta + \gamma/2 for symmetric innovations.

Daily EUR/USD absolute returns and the conditional volatility of the fitted GARCH(1,1) with Student-t innovations, 1999–2026. The clusters (2000, 2008–2009, 2011, 2015, 2022) are what the model’s persistence of 0.9984 describes. Data: ECB euro reference rates (source: ECB statistics).
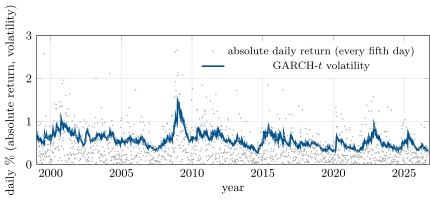
Figure 18.1. Daily EUR/USD absolute returns and the conditional volatility of the fitted GARCH(1,1) with Student-tt innovations, 1999–2026. The clusters (2000, 2008–2009, 2011, 2015, 2022) are what the model’s persistence of 0.9984 describes. Data: ECB euro reference rates (source: ECB statistics).
How long one 3.5% daily return stays in each variance forecast (the extra variance over a background of 0.5% days). GARCH lets it decay slowly (half-life 445 days), EWMA quickly (11 days), and the equally weighted window keeps it whole for 250 days and then drops it in one step. Data: the chapter’s tutorial, from the fitted parameters.
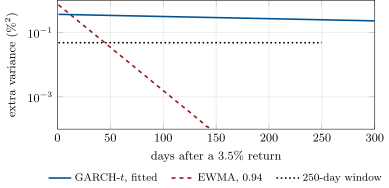
Figure 18.2. How long one 3.5% daily return stays in each variance forecast (the extra variance over a background of 0.5% days). GARCH lets it decay slowly (half-life 445 days), EWMA quickly (11 days), and the equally weighted window keeps it whole for 250 days and then drops it in one step. Data: the chapter’s tutorial, from the fitted parameters.
Lire dans le chapitre →