 Coach
CoachThe leverage function of a stochastic-local volatility model is the function that makes the model reprice every vanilla. By the Markovian projection of chapter 9 it satisfies
with the market’s local volatility.
Exemplos
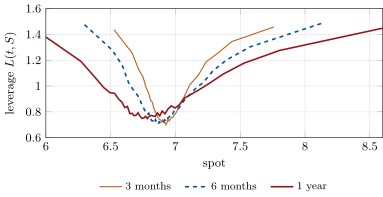
Example 20.11 (The leverage function of the pair)
With mixing , the calibrated near the forward is 0.76 at three months, 0.73 at six months and 0.79 at one year. It rises to about 1.4 or 1.5 in both wings (Figure 20.4). All three models reprice the one-year smile: at the 10-delta put, the 25-delta put, the at-the-money straddle, the 25-delta call and the 10-delta call, stochastic-local volatility gives 5.22%, 4.90%, 5.38%, 6.77% and 8.96%, against the market’s 5.14%, 4.84%, 5.32%, 6.72% and 8.91%. The differences, below a tenth of a point, come from the simulation’s daily Euler steps.