جميع الكتب

مهني

1 Markets I: The Ecosystem and Exchange-Traded Marketsالأسواق عبر الإنترنت 2 Markets II: Rates, FX and Creditالأسواق عبر الإنترنت 3 Markets III: Commodities, Energy and Cryptoالأسواق عبر الإنترنت 4 Quantitative Methodsالأساليب عبر الإنترنت 5 Derivatives and Volatilityالمشتقات عبر الإنترنت 6 Rates, Credit, XVA and Riskالفائدة والائتمان والمخاطر عبر الإنترنت 7 Research Craft: Predictors, Backtests, Measurement, Portfoliosالبحث عبر الإنترنت 8 Strategies I: Equities and Futuresالاستراتيجيات عبر الإنترنت 9 Strategies II: Volatility, Relative Value, Macro and the Bank Desksالاستراتيجيات عبر الإنترنت 10 Microstructure and Executionالتنفيذ عبر الإنترنت 11 Market Making and High-Frequency Tradingصناعة السوق عبر الإنترنت 12 Machine Learning for Marketsتعلم الآلة عبر الإنترنت 13 Low-Latency Softwareالتكنولوجيا عبر الإنترنت 14 Networks, Hardware and Trading Infrastructureالتكنولوجيا عبر الإنترنت 15 Research, Data and Risk Platformsالتكنولوجيا عبر الإنترنت 16 The Desk and the Firmالشركة عبر الإنترنت 17 The Industry: Firms, Roles and Careersالمسارات المهنية عبر الإنترنت 18 The Interview Bookالمسارات المهنية عبر الإنترنت
التطبيقات حول المدرب تسجيل الدخول ابدأ القراءة

Quantitative Finance · المسرد

ما معنى Maximum drawdown, drawdown duration, Calmar ratio؟

يُعرف أيضًا باسم: maximum drawdown · drawdown duration · Calmar ratio

Definition 22.4 Research Craft: Predictors, Backtests, Measurement, Portfolios · الفصل 22 — Performance Measurement

The maximum drawdown of a history is its largest fall of wealth from a running peak, as a fraction of the peak (drawdown: Book 2, chapter 29). The drawdown duration of a spell is the time from the peak to the recovery of that peak, or to the end of the history if it has not recovered. The Calmar ratio is the annualised return over the absolute maximum drawdown, traditionally on three years.
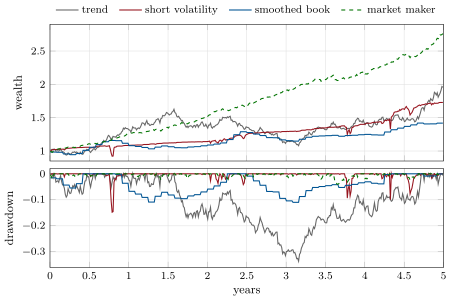
The four displayed five-year histories: wealth (top) and drawdown from the running peak (bottom). The smoothed book is monthly and drawn as steps of a month. Data: rs_perf.histories.
Figure 22.1. The four displayed five-year histories: wealth (top) and drawdown from the running peak (bottom). The smoothed book is monthly and drawn as steps of a month. Data: rs_perf.histories.
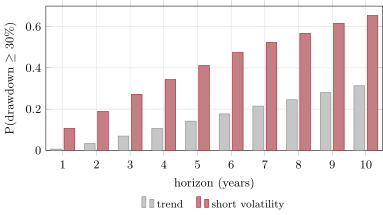
The probability of a drawdown of 30% or more within a horizon, over 4 000 simulated paths of each strategy’s model (long-run volatilities of 15% and 17%). Data: rs_perf.dd_probability.
Figure 22.2. The probability of a drawdown of 30% or more within a horizon, over 4 000 simulated paths of each strategy’s model (long-run volatilities of 15% and 17%). Data: rs_perf.dd_probability.
اقرأ في الفصل →