
جميع الكتب

مهني

1 Markets I: The Ecosystem and Exchange-Traded Marketsالأسواق عبر الإنترنت 2 Markets II: Rates, FX and Creditالأسواق عبر الإنترنت 3 Markets III: Commodities, Energy and Cryptoالأسواق عبر الإنترنت 4 Quantitative Methodsالأساليب عبر الإنترنت 5 Derivatives and Volatilityالمشتقات عبر الإنترنت 6 Rates, Credit, XVA and Riskالفائدة والائتمان والمخاطر عبر الإنترنت 7 Research Craft: Predictors, Backtests, Measurement, Portfoliosالبحث عبر الإنترنت 8 Strategies I: Equities and Futuresالاستراتيجيات عبر الإنترنت 9 Strategies II: Volatility, Relative Value, Macro and the Bank Desksالاستراتيجيات عبر الإنترنت 10 Microstructure and Executionالتنفيذ عبر الإنترنت 11 Market Making and High-Frequency Tradingصناعة السوق عبر الإنترنت 12 Machine Learning for Marketsتعلم الآلة عبر الإنترنت 13 Low-Latency Softwareالتكنولوجيا عبر الإنترنت 14 Networks, Hardware and Trading Infrastructureالتكنولوجيا عبر الإنترنت 15 Research, Data and Risk Platformsالتكنولوجيا عبر الإنترنت 16 The Desk and the Firmالشركة عبر الإنترنت 17 The Industry: Firms, Roles and Careersالمسارات المهنية عبر الإنترنت 18 The Interview Bookالمسارات المهنية عبر الإنترنت
التطبيقات حول المدرب تسجيل الدخول ابدأ القراءة

Quantitative Finance · المسرد

ما معنى P&L attribution test؟

يُعرف أيضًا باسم: P\&L attribution test

Definition 23.11 Rates, Credit, XVA and Risk · الفصل 23 — Regulatory Capital for Trading Books

The P&L attribution test compares a desk’s HPL and RTPL over 250 days by the Spearman correlation of their ranks and the Kolmogorov–Smirnov distance between their distributions: green if the correlation exceeds 0.80 and the distance is below 0.09, red if the correlation is below 0.70 or the distance above 0.12, amber otherwise. Red desks use the standardised approach; amber desks pay a surcharge of half the gap between the standardised and internal-model charges (for a bank whose only desk is amber).
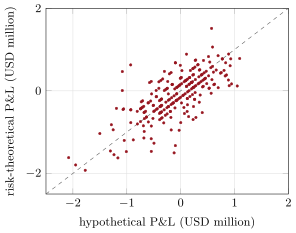
Daily hypothetical P&L of the book against the P&L of a risk model that proxies the ten-year yield by the two-year, over 250 days. The ranks agree only loosely (Spearman 0.703): amber. Data: US Treasury, ECB; the chapter’s tutorial.
Figure 23.3. Daily hypothetical P&L of the book against the P&L of a risk model that proxies the ten-year yield by the two-year, over 250 days. The ranks agree only loosely (Spearman 0.703): amber. Data: US Treasury, ECB; the chapter’s tutorial.

أمثلة

Example 23.12 (Three risk models of the same desk)

Over the last 250 days, a risk model that revalues the book with the delta–gamma expansion passes easily (Spearman 1.00, KS 0.008). One that has no yen factor passes too (0.956 and 0.060). One that has no two-year factor is amber through its distribution (0.949 and 0.100). One that proxies the ten-year yield by the two-year, a common response to a factor judged non-modellable, is amber through its correlation: 0.703 and 0.044 (Figure 23.3).

اقرأ في الفصل →