 Pelatih
The P&L attribution test compares a desk’s HPL and RTPL over 250 days by the Spearman correlation of their ranks and the Kolmogorov–Smirnov distance between their distributions: green if the correlation exceeds 0.80 and the distance is below 0.09, red if the correlation is below 0.70 or the distance above 0.12, amber otherwise. Red desks use the standardised approach; amber desks pay a surcharge of half the gap between the standardised and internal-model charges (for a bank whose only desk is amber).
Contoh
Example 23.12 (Three risk models of the same desk)
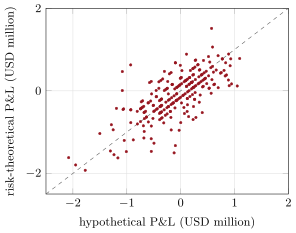
Over the last 250 days, a risk model that revalues the book with the delta–gamma expansion passes easily (Spearman 1.00, KS 0.008). One that has no yen factor passes too (0.956 and 0.060). One that has no two-year factor is amber through its distribution (0.949 and 0.100). One that proxies the ten-year yield by the two-year, a common response to a factor judged non-modellable, is amber through its correlation: 0.703 and 0.044 (Figure 23.3).