
جميع الكتب

مهني

1 Markets I: The Ecosystem and Exchange-Traded Marketsالأسواق عبر الإنترنت 2 Markets II: Rates, FX and Creditالأسواق عبر الإنترنت 3 Markets III: Commodities, Energy and Cryptoالأسواق عبر الإنترنت 4 Quantitative Methodsالأساليب عبر الإنترنت 5 Derivatives and Volatilityالمشتقات عبر الإنترنت 6 Rates, Credit, XVA and Riskالفائدة والائتمان والمخاطر عبر الإنترنت 7 Research Craft: Predictors, Backtests, Measurement, Portfoliosالبحث عبر الإنترنت 8 Strategies I: Equities and Futuresالاستراتيجيات عبر الإنترنت 9 Strategies II: Volatility, Relative Value, Macro and the Bank Desksالاستراتيجيات عبر الإنترنت 10 Microstructure and Executionالتنفيذ عبر الإنترنت 11 Market Making and High-Frequency Tradingصناعة السوق عبر الإنترنت 12 Machine Learning for Marketsتعلم الآلة عبر الإنترنت 13 Low-Latency Softwareالتكنولوجيا عبر الإنترنت 14 Networks, Hardware and Trading Infrastructureالتكنولوجيا عبر الإنترنت 15 Research, Data and Risk Platformsالتكنولوجيا عبر الإنترنت 16 The Desk and the Firmالشركة عبر الإنترنت 17 The Industry: Firms, Roles and Careersالمسارات المهنية عبر الإنترنت 18 The Interview Bookالمسارات المهنية عبر الإنترنت
التطبيقات حول المدرب تسجيل الدخول ابدأ القراءة

Quantitative Finance · المسرد

ما معنى Risk-neutral density and the Breeden–Litzenberger formula؟

يُعرف أيضًا باسم: risk-neutral density · Breeden--Litzenberger formula

Definition 7.6 Derivatives and Volatility · الفصل 7 — Implied Volatility and Its Surface

The risk-neutral density of STS_T is the density qT(s)q_T(s) of the underlying at TT under the risk-neutral measure (One Quant Book 4, chapter 5); it is the continuous version of the state prices of chapter 1, divided by the discount factor. The Breeden–Litzenberger formula reads it off call prices:
qT(K)=1P(0,T) ∂2C(K,T)∂K2.q_T(K)=\frac{1}{P(0,T)}\,\frac{\partial^2C(K,T)}{\partial K^2}.
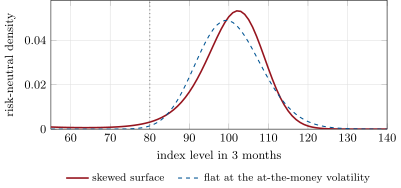
Risk-neutral densities of the index in three months from Breeden–Litzenberger applied to call prices: with the chapter’s skew (solid) and with a flat surface at the same at-the-money volatility (dashed). The skew moves probability into the left tail and makes the density’s peak sit above the forward; the probability below 80 (dotted) rises from 0.31% to 1.89%. Data: the tutorial.
Figure 7.4. Risk-neutral densities of the index in three months from Breeden–Litzenberger applied to call prices: with the chapter’s skew (solid) and with a flat surface at the same at-the-money volatility (dashed). The skew moves probability into the left tail and makes the density’s peak sit above the forward; the probability below 80 (dotted) rises from 0.31% to 1.89%. Data: the tutorial.

أمثلة

Example 7.7 (The crash premium)

On the chapter’s surface the three-month forward is 100.37 and the at-the-money volatility 16.36%. With a flat surface at that level the risk-neutral probability that the index ends below 80 is 0.31%; with the skew, whose 80 strike is at 26.8 volatility, it is 1.89%, six times more (Figure 7.4). The 80 put costs 0.006 on the flat surface and 0.219 on the skewed one.

اقرأ في الفصل →