All books

Professional

Apps About Coach Log in Start reading

Quantitative Finance · Glossary

What is Rough Bergomi model?

Definition 12.6 Derivatives and Volatility · Chapter 12 — Rough Volatility and Forward-Variance Models

The rough Bergomi model is the forward-variance model with the power-law kernel. Its spot variance is

vt=ξ0(t)exp⁡(ηYt−12η2t2H),Yt=2H∫0t(t−s)H−1/2 dWs1,v_t=\xi_0(t)\exp\Bigl(\eta Y_t-\tfrac12\eta^2t^{2H}\Bigr),\qquad Y_t=\sqrt{2H}\int_0^t(t-s)^{H-1/2}\,dW^1_s,

and the underlying follows dSt/St=vt (ρ dWt1+1−ρ2 dWt⊥)dS_t/S_t=\sqrt{v_t}\,\bigl(\rho\,dW^1_t+\sqrt{1-\rho^2}\,dW^\perp_t\bigr). YY is a Riemann–Liouville fractional Brownian motion with Var⁡(Yt)=t2H\Var(Y_t)=t^{2H}, so E[vt]=ξ0(t)\E[v_t]=\xi_0(t): the model fits the forward-variance curve by construction. It has three parameters, HH, η\eta and ρ\rho.

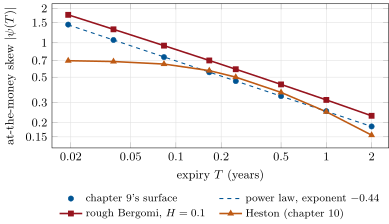
The at-the-money skew by expiry on log-log axes, from one week to two years. The surface and rough Bergomi follow straight lines; Heston’s skew levels off below two months. Data: the tutorial.
Figure 12.4. The at-the-money skew by expiry on log-log axes, from one week to two years. The surface and rough Bergomi follow straight lines; Heston’s skew levels off below two months. Data: the tutorial.

Examples

Example 12.8 (The skew term structure)

Rough Bergomi with a flat 20% forward volatility, H=0.1H=0.1, η=1.9\eta=1.9 and ρ=−0.9\rho=-0.9 (illustrative values, not a calibration) gives an at-the-money skew of −1.76-1.76 at one week and −0.32-0.32 at one year. A power law fitted from one week to two years has exponent −0.44-0.44. On the same expiries chapter 9’s surface has −1.44-1.44 and −0.25-0.25 and exponent −0.44-0.44 as well. Heston calibrated to that surface in chapter 10 comes within 0.04 of it from three months on, but its skew at one week is −0.70-0.70, and its exponent over the first two months is −0.09-0.09: nearly flat (Figure 12.4).

Read in context →