Tous les livres

Professionnel

Applis À propos Coach Connexion Commencer la lecture

Quantitative Finance · Glossaire

Qu'est-ce que « Signature plot » ?

Definition 21.3 Quantitative Methods · Chapitre 21 — High-Frequency Econometrics

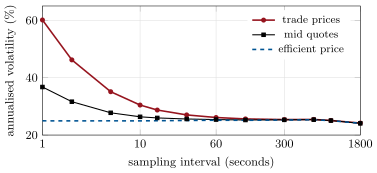
A signature plot draws average realised volatility against the sampling interval: flat without noise, rising toward the shortest intervals with it (Andersen, Bollerslev, Diebold and Labys, 2000, who named it the volatility signature plot).

Signature plot of the simulated stock (efficient volatility 25%, one-cent grid around 36 dollars, a trade every second at the bid or the ask), averaged over thirty days: realised volatility against the sampling interval. The bounce and the grid add 35 points at one second and almost nothing beyond two minutes. Data: the chapter’s tutorial, seeded.
Figure 21.1. Signature plot of the simulated stock (efficient volatility 25%, one-cent grid around 36 dollars, a trade every second at the bid or the ask), averaged over thirty days: realised volatility against the sampling interval. The bounce and the grid add 35 points at one second and almost nothing beyond two minutes. Data: the chapter’s tutorial, seeded.
Lire dans le chapitre →