 Pelatih
The traffic-light test classifies a 99% VaR model by its exceptions over 250 days: green for 0 to 4, yellow for 5 to 9 with increases of 0.40, 0.50, 0.65, 0.75 and 0.85 in the capital multiplication factor of 3, red for 10 or more (an increase of 1). Under the 1996 rules, capital is the higher of the previous day’s ten-day VaR and the factor times its average over the preceding sixty business days.
Contoh
Example 21.17 (Four years of backtesting)
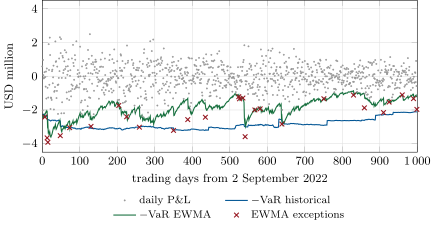
Recomputing each model every day from 2 September 2022 to 23 September 2026, on the same book revalued at each day’s levels, against the next day’s P&L: historical simulation has 10 exceptions in 1 000 days (Kupiec p-value 1.00) and none in the last 250, green; the EWMA delta-normal model has 28 (Kupiec likelihood ratio 22.0, p-value ) and 8 in the last 250, yellow with a 0.75 increase; filtered historical simulation has 8 and 3, green (Figure 21.3). None fails the independence test at 5%.