جميع الكتب

مهني

1 Markets I: The Ecosystem and Exchange-Traded Marketsالأسواق عبر الإنترنت 2 Markets II: Rates, FX and Creditالأسواق عبر الإنترنت 3 Markets III: Commodities, Energy and Cryptoالأسواق عبر الإنترنت 4 Quantitative Methodsالأساليب عبر الإنترنت 5 Derivatives and Volatilityالمشتقات عبر الإنترنت 6 Rates, Credit, XVA and Riskالفائدة والائتمان والمخاطر عبر الإنترنت 7 Research Craft: Predictors, Backtests, Measurement, Portfoliosالبحث عبر الإنترنت 8 Strategies I: Equities and Futuresالاستراتيجيات عبر الإنترنت 9 Strategies II: Volatility, Relative Value, Macro and the Bank Desksالاستراتيجيات عبر الإنترنت 10 Microstructure and Executionالتنفيذ عبر الإنترنت 11 Market Making and High-Frequency Tradingصناعة السوق عبر الإنترنت 12 Machine Learning for Marketsتعلم الآلة عبر الإنترنت 13 Low-Latency Softwareالتكنولوجيا عبر الإنترنت 14 Networks, Hardware and Trading Infrastructureالتكنولوجيا عبر الإنترنت 15 Research, Data and Risk Platformsالتكنولوجيا عبر الإنترنت 16 The Desk and the Firmالشركة عبر الإنترنت 17 The Industry: Firms, Roles and Careersالمسارات المهنية عبر الإنترنت 18 The Interview Bookالمسارات المهنية عبر الإنترنت
التطبيقات حول المدرب تسجيل الدخول ابدأ القراءة

Quantitative Finance · المسرد

ما معنى Win-probability model؟

Definition 22.3 Market Making and High-Frequency Trading · الفصل 22 — Bond and ETF Request-for-Quote Market Making

A win-probability model estimates the probability that a dealer’s quote wins a request for quote, as a function of the quote’s distance from the dealer’s fair value and of the request’s features (size, side, client, bond, time since the last print, number of dealers asked), fitted on the dealer’s history of wins, losses and covers.
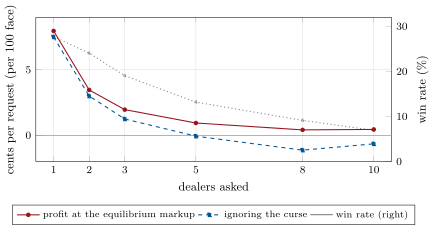
A dealer’s expected profit per request answered, in cents per 100 of face value, at the symmetric equilibrium markup and at the markup a model ignoring the winner’s curse would choose (competitors at the equilibrium), and the equilibrium win rate (right), against the number of dealers asked; estimates off by 25 cents, urgency discounts with a mean of 30 cents, 40 000 requests per point. Data: hf_rfq.equilibria.
Figure 22.2. A dealer’s expected profit per request answered, in cents per 100 of face value, at the symmetric equilibrium markup and at the markup a model ignoring the winner’s curse would choose (competitors at the equilibrium), and the equilibrium win rate (right), against the number of dealers asked; estimates off by 25 cents, urgency discounts with a mean of 30 cents, 40 000 requests per point. Data: hf_rfq.equilibria.
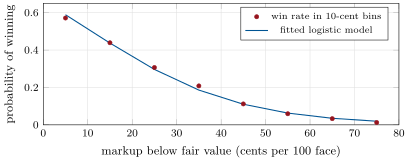
The win-probability model: win rates of 20 000 historical requests grouped by markup, and the logistic curve fitted to them by Newton’s method, against five dealers at the equilibrium markup of 42.5 cents. Data: hf_rfq.win_model.
Figure 22.3. The win-probability model: win rates of 20 000 historical requests grouped by markup, and the logistic curve fitted to them by Newton’s method, against five dealers at the equilibrium markup of 42.5 cents. Data: hf_rfq.win_model.
اقرأ في الفصل →