Market Making and High-Frequency Trading · Market making
22Bond and ETF Request-for-Quote Market Making
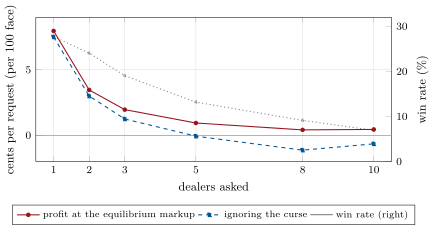
A corporate bond that last traded three weeks ago is on the screen, in a request from an asset manager to five dealers. One of them answers in under a second, without a human, because its model has already priced the bond from its neighbours. In this chapter’s auction, five dealers whose estimates of such a bond are each off by a quarter of a point settle on markups of about 43 cents; the winner makes 0.94 cents per request it answers and wins 13% of them. A dealer that sets its markup as if its estimate were right would win 31% and lose money.
22.1 Pricing bonds that do not trade
Most corporate bonds trade rarely (One Quant Book 2, chapter 22): an issue may print a few times a month, a request for quote may be the only price discovery it gets in a week. A dealer’s fair value for such a bond is assembled, not observed. Three sources feed it:
- its own prints, from the trade reporting system, weighted by recency and cleaned of outliers into a composite (Book 2’s
firm.rfq.composite), and moved since by the issuer’s curve; - comparables: the same issuer’s other bonds, bonds of similar rating, sector and maturity, each with its sensitivity to the target;
- liquid proxies: the Treasury curve, credit indices and bond exchange-traded funds, which move every second and carry the market-wide part of the bond’s value.
firm.rfqmm.fair_value blends the first two. Whatever the method, the estimate has an error, and for a bond that has not traded for weeks the error is large relative to the bid–ask spread a dealer can charge. The chapter’s model takes it at 25 cents per 100 of face value, one standard deviation, for every dealer; each dealer’s error is its own.
22.2 Auto-quoting request for quote
Definition 22.1 (Auto-quoting)
Auto-quoting is a dealer’s automatic response to requests for quote: a system that prices each request from its models and inventory, decides whether and at what level to answer, and sends the answer without a trader, within limits set by the desk and with requests outside them routed to a person.
Hendershott and Madhavan studied the innovation at the heart of it (Figure 22.1): electronic technology that lets an investor search many bond dealers at once. They showed that periodic one-sided electronic auctions are a viable and important source of liquidity even in inactively traded bonds, a compromise between bilateral search and a continuous order book. O’Hara and Zhou, combining a platform’s proprietary data with the regulatory trade reports, found electronic request-for-quote trading still fairly small and segmented, but with wide-ranging effects on transaction costs and execution quality in both electronic and voice trading, and in the interdealer market: a market in transition.
As of September 2026 — One platform’s year
MarketAxess reported record revenue of $846 million for 2025, a 48% increase in portfolio-trading average daily volume to a record $1.4 billion, a 24% increase in block-trading average daily volume to a record $5 billion and a 33% increase in dealer-initiated volume; about 2 100 firms use its platform.
22.3 Win probability and the winner’s curse
Definition 22.2 (Cover price)
The cover price is the second-best quote in a request for quote, which many platforms disclose to the winning dealer after the trade; it tells the winner how much it could have shaded its quote and still won.
Definition 22.3 (Win-probability model)
A win-probability model estimates the probability that a dealer’s quote wins a request for quote, as a function of the quote’s distance from the dealer’s fair value and of the request’s features (size, side, client, bond, time since the last print, number of dealers asked), fitted on the dealer’s history of wins, losses and covers.
The dealer chooses its markup , the distance of its bid below its fair value, to maximise . The second factor is where the winner’s curse lives: the dealer whose estimate is highest wins most often, so its estimate, given that it won, is too high. With five dealers each off by 25 cents, the highest estimate is 29 cents too high on average before any markup (the expected largest of five normal errors, Book 2’s firm.rfq.expected_max_normal); with ten, 38.5 cents.
The chapter’s auction (Listing 22.1): the client sells to the best bid if it is at least its reservation price, the bond’s value less an urgency discount with a mean of 30 cents. Competitors use a common markup; ours is the best response; the equilibrium is the markup at which the best response to everyone using it is itself. A model that ignores the curse maximises , as if the profit on a win were the markup.
hf_rfq.equilibria.| dealers asked | 1 | 2 | 3 | 5 | 8 | 10 |
|---|---|---|---|---|---|---|
| equilibrium markup (cents) | 47.5 | 40.0 | 40.0 | 42.5 | 45.0 | 50.0 |
| profit per request (cents) | 7.96 | 3.46 | 1.96 | 0.94 | 0.41 | 0.45 |
| win rate | 27.7% | 24.0% | 19.1% | 13.2% | 9.1% | 6.9% |
| winner’s error given a win (cents) | 18.8 | 25.6 | 29.7 | 35.4 | 40.5 | 43.5 |
| markup ignoring the curse (cents) | 37.5 | 30.0 | 27.5 | 25.0 | 22.5 | 25.0 |
| its profit per request (cents) | 7.50 | 2.99 | 1.25 |
The results (Figure 22.2): the equilibrium markup does not fall with more dealers, it rises after three, because the curse grows faster than competition narrows the spread; profit per request falls from 8 cents alone to under half a cent with eight or ten. The dealer that ignores the curse quotes 20 to 25 cents tighter, wins more than twice as often, and loses from five dealers on. Even alone it earns less, because a single dealer’s winning bids are also selected, by the client’s reservation price.
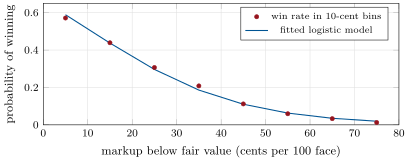
The win-probability model is learned from history. Fitting a logistic curve to 20 000 past requests with markups spread from 0 to 80 cents against five competitors at the equilibrium (Listing 22.2) gives : 12.6% at the equilibrium markup, against 13.2% simulated (Figure 22.3). The cover feeds the model: each win reveals how far the dealer could have shaded, each loss nothing, which biases naive estimates of the distribution of competitors’ quotes; models of it are fitted with that censoring in mind.
hf_rfq.win_model.22.4 ETF request for quote and block liquidity
Institutions trade large blocks of exchange-traded funds by request for quote, off the exchange’s order book. The dealer’s bid for a block comes from the creation basket (chapter 12): it can buy the shares and redeem them, receiving the basket, which it sells. Its bid is the basket’s bid less the redemption’s costs: the fixed fee spread over the unit’s shares, the basket’s selling cost and the hedge while the redemption settles. For a fund whose basket bids $100.00, with units of 50 000 shares, a $1 250 fee, 5 basis points to sell the basket and 1 to hedge, the dealer can bid $99.915 a share for a block of any size that fits its balance sheet. The winner’s curse is small here, because the basket is priced continuously; the risk is in the basket’s liquidity when the block is large.
22.5 Portfolio trades and all-to-all
A portfolio trade (Book 2, chapter 22) prices a list of hundreds of bonds as one package, often against an exchange-traded fund that holds most of them: the dealer’s model prices every line, and the package’s diversification shrinks the winner’s curse on the whole relative to the sum of its parts. The dated box’s growth in portfolio trading is the market choosing that trade. All-to-all trading (Book 2, chapter 22) lets investors answer each other’s requests anonymously: non-dealers become liquidity providers, and the auto-quoter competes with them.
22.6 Strategy files
Strategy file 22.1 — Algorithmic corporate-bond request-for-quote responder
Who pays you, and why. Investors who need to trade bonds that rarely trade, and pay for a dealer’s balance sheet and estimate.
Instruments and venues. Corporate bonds on dealer-to-client platforms.
Signal. A fair value from the bond’s stale prints, comparables and liquid proxies; the win-probability model.
Sizing and execution. Answer automatically within limits; set the markup from the model with the winner’s curse; route large or unusual requests to a trader.
Costs. The curse (35 cents of error given a win against five dealers in the model); inventory financing and hedging.
How it dies. Markups set as if the estimate were right (with five dealers the naive quoter wins 31% of requests and loses money); and stress, when every estimate goes stale at once, as in the corporate bond dislocation of March 2020 (One Quant Book 9, chapter 19).
Horizon, capacity, infrastructure. Seconds to answer, days to weeks to unwind; the platform’s connections and trade reports.
Backtest honestly. The requests the dealer actually received, the quotes competitors made (censored by what was disclosed), the prices at which the inventory could be sold.
Sources. Hendershott and Madhavan (2015); O’Hara and Zhou (2021); this chapter.
Strategy file 22.2 — ETF request-for-quote market making
Who pays you, and why. Institutions trading fund blocks larger than the exchange’s displayed depth.
Instruments and venues. Exchange-traded funds by request for quote; their baskets; the primary market.
Signal. The basket’s executable value and the costs of creating or redeeming.
Sizing and execution. Quote from the basket less (or plus) the primary market’s costs; hedge in the basket or a future at once.
Costs. Creation fees, the basket’s spread, the hedge.
How it dies. Illiquid baskets in a stress, where the basket’s bid is itself an estimate: the bond-fund discounts of March 2020 (One Quant Book 9, chapter 19) and chapter 12’s simulated freeze.
Horizon, capacity, infrastructure. Seconds to a day; the fund’s creation cut-off.
Backtest honestly. Basket prices at the request’s time; the fee schedule; settlement.
Sources. Chapter 12; the dated box.
Strategy file 22.3 — Treasury streaming and request for quote
Who pays you, and why. Investors trading Treasuries on dealer-to-client platforms, who prefer a disclosed dealer’s firm price.
Instruments and venues. On-the-run and off-the-run Treasuries; streams and requests on dealer-to-client platforms.
Signal. The interdealer order books (One Quant Book 2, chapter 4) for on-the-runs; a fitted curve for off-the-runs.
Sizing and execution. Stream tight on on-the-runs, hedge in the interdealer market or futures; answer requests on off-the-runs from the curve.
Costs. Hedge spreads; curve-fit error on off-the-runs.
How it dies. Competitors with faster interdealer access, and days when the interdealer book thins: on 15 October 2014 the ten-year yield fell 16 basis points between 9:33 and 9:39 a.m. and nearly retraced it by 9:45, with no apparent trigger and uncharacteristically shallow depth (the official joint staff report of 2015).
Horizon, capacity, infrastructure. Milliseconds to hours.
Backtest honestly. Interdealer prices at each request’s time, not the day’s close.
Sources. One Quant Book 2, chapter 4; Joint Staff Report, The U.S. Treasury market on October 15, 2014 (2015).
Strategy file 22.4 — All-to-all anonymous liquidity provision
Who pays you, and why. Investors whose requests reach non-dealers anonymously.
Instruments and venues. Corporate bonds on all-to-all protocols.
Signal. The same fair value, with no client identity to price.
Sizing and execution. Answer where the model’s estimate is best (bonds with recent prints, close comparables); size small.
Costs. A curse sharper than with known clients, since the flow cannot be tiered.
How it dies. Adverse selection from better-informed anonymous requesters.
Horizon, capacity, infrastructure. Seconds to days.
Backtest honestly. Anonymous requests’ later price moves by requester type where the platform reports it.
Sources. O’Hara and Zhou (2021); Book 2, chapter 22.
22.7 Tutorial: five dealers and a bond nobody traded
Goal. Find the equilibrium markup of an auto-quoter against competitors with the same estimation error, measure the winner’s curse, and fit a win-probability model. End state: the table and the three figures.
The auction: every dealer’s estimate with its own error, the client’s reservation price, the best bid.
    rng = np.random.default_rng(seed)
    e = rng.standard_normal((n, n_dealers)) * sigma_est
    if our_sigma is not None:
        e[:, 0] *= our_sigma / sigma_est
    bids = e.copy()
    bids[:, 0] -= our_markup
    bids[:, 1:] -= comp_markup
    reservation = -rng.exponential(urgency, n)
    best = bids.max(axis=1)
    traded = best >= reservation
    win = traded & (bids[:, 0] >= best)
    pnl = np.where(win, -bids[:, 0], 0.0)
    cover = bids[:, 1:].max(axis=1) if n_dealers > 1 else np.full(n, -np.inf)
    return {"win": win, "pnl": pnl, "cover": cover, "our_error": e[:, 0], "traded": traded, "our_bid": bids[:, 0]}
Listing 22.1. Estimates, markups, the client’s choice, and the winner’s profit against the true value. code/firm/rfqmm/firm_rfqmm.py - The equilibrium by best responses on a grid of markups (
firm.rfqmm.equilibrium). The win model fitted on a randomised history.
def fit_win_model(markups, wins, iters: int = 50) -> tuple[float, float]:
    """Logistic P(win) = 1 / (1 + exp(-(a + b m))) fitted by Newton's method."""
    x = np.asarray(markups, float)
    y = np.asarray(wins, float)
    X = np.column_stack([np.ones_like(x), x])
    beta = np.zeros(2)
    for _ in range(iters):
        p = 1.0 / (1.0 + np.exp(-(X @ beta)))
        W = p * (1 - p)
        H = X.T @ (X * W[:, None]) + 1e-9 * np.eye(2)
        beta += np.linalg.solve(H, X.T @ (y - p))
    return float(beta[0]), float(beta[1])
Listing 22.2. A logistic win probability in the markup, by Newton’s method. code/firm/rfqmm/firm_rfqmm.py - The ETF block bid from the creation basket (
firm.rfqmm.etf_rfq_bid).
What to change next. Give dealers different errors (a better model wins more and profits more); add inventory to the markup (axes); estimate the competitors’ distribution from covers with censoring.
22.8 Build: the RFQ market maker
Purpose. Price illiquid bonds, answer requests for quote at the markup that maximises expected profit net of the winner’s curse, and price ETF blocks from their baskets.
Interface. fair_value(prints, ages_days, comps, comp_betas, curve_move, half_life), simulate(n_dealers, our_markup, n, seed, sigma_est, comp_markup, urgency), optimise, equilibrium, naive_markup, fit_win_model, etf_rfq_bid. Built on firm.rfq (Book 2).
Rules. Cents per 100 of face value; the client sells; profit against the bond’s true value.
Acceptance tests. code/firm/rfqmm/tests/: the composite-based fair value within the comparables’ range; profit equals value less bid on wins; the winner’s average error is positive; higher markups win less; with five dealers profit and win rate are below one dealer’s; the naive markup is lower and earns less; the logistic fit recovers known coefficients; the ETF bid by hand.
Stretch. Heterogeneous dealers; inventory and axes; censored estimation from covers.
Sources and further reading
- T. Hendershott, A. Madhavan, Click or call? Auction versus search in the over-the-counter market, Journal of Finance 70(1), 2015, 419–447.
- M. O’Hara, X. A. Zhou, The electronic evolution of corporate bond dealers, Journal of Financial Economics 140(2), 2021, 368–390.
- MarketAxess Holdings, fourth quarter and full year 2025 results, Form 8-K exhibit 99.1, 6 February 2026.
- US Department of the Treasury, Federal Reserve, SEC and CFTC staff, Joint Staff Report: The U.S. Treasury market on October 15, 2014, July 2015.
22.9 Exercises
Exercise 22.1 ★
A fund’s basket bids $100.00; units are 50 000 shares; the fee is $1 250; selling the basket costs 5 basis points and hedging 1. What is the block bid per share?
Solution
Solution of Exercise 22.1.
.
Exercise 22.2 ★
With estimation errors of 25 cents and five dealers, by how much is the highest estimate too high on average?
Solution
Solution of Exercise 22.2.
cents.
Exercise 22.3 ★
The fitted model is . What is the probability of winning at a markup of 42.5 cents? At 20?
Solution
Solution of Exercise 22.3.
; at 20 cents, .
Exercise 22.4 ★★
Why does the equilibrium markup rise from five dealers to ten?
Solution
Solution of Exercise 22.4.
With more dealers the winner’s estimate is more selected: its expected error given a win rises (35 to 44 cents); the markup must cover it, and beyond a few dealers that effect outweighs competition.
Exercise 22.5 ★★
Why does disclosing the cover only to the winner bias a win-probability model fitted naively?
Solution
Solution of Exercise 22.5.
The dealer learns the competitors’ best quote only when it wins, that is, when the competitors were low; losses show only that someone was higher. A model fitted to covers alone underestimates the competition; the losses must enter as censored observations.
Exercise 22.6 ★★
Why is the winner’s curse smaller in a portfolio trade than in the sum of its lines?
Solution
Solution of Exercise 22.6.
The dealer’s errors on hundreds of lines partly cancel; the package’s value is estimated more precisely than any line, so the selection effect on the whole is smaller.
Exercise 22.7 ★★★
Coding. With firm.rfqmm.optimise, find our best markup against five competitors at 42.5 cents when our estimate’s error is 15 cents and theirs 25. What do we earn and win?
Solution
Solution of Exercise 22.7.
With a 15-cent error against competitors’ 25, our best markup is 25 cents; we earn 2.48 cents a request and win 23.4% of requests: a better estimate buys both volume and margin.
Exercise 22.8 ★★★
Find the flaw. “Our auto-quoter wins 30% of requests with a 25-cent markup, and our average markup on wins is 25 cents: it earns 25 cents a win.”
Solution
Solution of Exercise 22.8.
The profit on a win is the markup less the estimate’s error, and the error given a win is positive and large (35 cents with five dealers in the model): at a 25-cent markup the quoter loses on average.
22.10 Problem: Five Dealers and a Bond Nobody Traded
Problem 22.1
Weekend problem — five dealers and a bond nobody traded
A dealer automates its answers to requests for quote in illiquid corporate bonds.
Part I — Prices.
- How is a fair value assembled for a bond that has not traded for weeks?
- Define auto-quoting.
- What did Hendershott and Madhavan and O’Hara and Zhou find?
- Summarise the dated box.
Part II — The auction.
- Define the cover price and a win-probability model.
- Write the dealer’s objective and explain the winner’s curse in it.
- How large is the curse for five and ten dealers before markups?
- How is the equilibrium found?
Part III — Measurements.
- Give the equilibrium markup, profit and win rate for 1, 5 and 10 dealers.
- What does ignoring the curse do?
- How well does the logistic model fit?
- Price the ETF block of the example.
Part IV — The verdict.
- State the named result: the auto-quoter’s profit per request and win rate at its optimal markup, and how both change with the number of dealers asked.
- How many dealers should a client ask?
- What does a better estimate than the competitors’ buy?
- Why do portfolio trades grow?
- What changes in all-to-all trading?
- Which strategy file is most exposed to the curse?
- How would you estimate competitors’ quotes from covers?
- In one sentence: what does a bond auto-quoter sell?
Solution
Solution of Problem 22.1.
- Its stale prints as a composite moved by the issuer curve, comparables with their sensitivities, and liquid proxies.
- See Definition 22.1.
- Electronic one-sided auctions are viable even for inactive bonds; electronic RFQ trading, though still segmented, changes costs and execution quality across the market.
- MarketAxess’s 2025: record revenue of $846 million, portfolio trading up 48% to $1.4 billion a day, blocks up 24% to $5 billion.
- See Definition 22.2 and Definition 22.3.
- ; the second term is reduced by the error of the estimate that won, which is positive.
- 29 and 38.5 cents.
- Best responses to a common competitor markup until the markup reproduces itself.
- 47.5 cents, 7.96 cents, 27.7%; 42.5, 0.94, 13.2%; 50.0, 0.45, 6.9%.
- It quotes 20 to 25 cents tighter, wins more than twice as often, and loses from five dealers on.
- 12.6% fitted against 13.2% simulated at the equilibrium markup.
- $99.915 a share.
- Profit per request falls from 7.96 cents alone to 0.94 with five dealers and about 0.4 with eight to ten; the win rate from 28% to 13% and 7%; the markup stays between 40 and 50 cents.
- Enough to get competition, few enough to limit the curse and the information leaked (Book 2’s
firm.rfq.best_n). - Both win rate and margin: 23.4% and 2.48 cents a request against five average competitors, against 13.2% and 0.94.
- Diversification shrinks the curse on a package, and funds offer a hedge.
- Anonymous requesters cannot be tiered; the auto-quoter competes with investors.
- The corporate-bond responder.
- As censored observations: covers bound the competitors from below when won, losses from above.
- A price, within a second, for a bond the market has not priced in weeks.
22.11 Interview questions
Interview question 22.1 ★ trader
You won a request at 99.50 and the cover was 99.20. What does that tell you?
Solution
Solution of Interview question 22.1.
You paid 30 cents more than you needed to win; either your estimate was high, or your markup too thin. One observation is noise; many feed the win model.
What the interviewer is looking for: the cover as information, and the curse.
Interview question 22.2 ★★ researcher
How would you price a bond that has not traded in a month?
Solution
Solution of Interview question 22.2.
Last prints moved by the issuer curve since, comparables’ spreads adjusted for maturity and seniority, and the market move from liquid proxies; widen the uncertainty with the time since the last print.
What the interviewer is looking for: comparables and the age of information.
Interview question 22.3 ★★ developer
Design an auto-quoter that answers 50 000 requests a day within 500 milliseconds each. Where are the risks?
Solution
Solution of Interview question 22.3.
Precomputed fair values updated on market moves; a fast win model; limits on size, inventory and bond lists; routing unusual requests to traders. Risks: stale inputs, wrong reference data, runaway quoting in a stress.
What the interviewer is looking for: precomputation and limits.
Interview question 22.4 ★★ risk
The auto-quoter’s win rate doubled last month. What do you check?
Solution
Solution of Interview question 22.4.
Whether the fair values drifted high (the curse), whether competitors withdrew, whether the client mix changed; the P&L of recent wins against later prices.
What the interviewer is looking for: win rate as a warning.
Interview question 22.5 ★★ trader
A client asks you and nineteen other dealers. How do you quote?
Solution
Solution of Interview question 22.5.
With twenty dealers the curse is large: quote wider, or not at all unless the estimate is unusually good or the inventory wants the bond.
What the interviewer is looking for: curse grows with dealers asked.
Interview question 22.6 ★★★ researcher
With dealers whose estimates have independent normal errors of standard deviation , derive the expected error of the highest estimate for .
Solution
Solution of Interview question 22.6.
The maximum of two independent has mean .
What the interviewer is looking for: order statistics.