सभी किताबें

पेशेवर

ऐप्स परिचय Coach लॉग इन पढ़ना शुरू करें

Quantitative Finance · शब्दावली

Year-on-year convexity adjustment क्या है?

Definition 11.3 Rates, Credit, XVA and Risk · अध्याय 11 — Inflation Derivatives

The year-on-year convexity adjustment of period ii is the difference between ENTi[I(Ti)/I(Ti−1)]\E^{T_i}_N[I(T_i)/I(T_{i-1})] and the ratio of forward indices I(0,Ti)/I(0,Ti−1)I(0,T_i)/I(0,T_{i-1}).

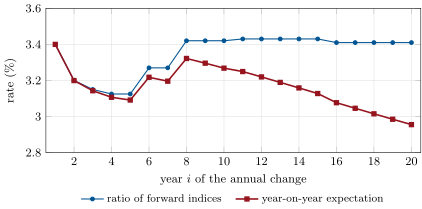
Annual inflation implied by zero-coupon swaps (ratio of forward indices) and the model’s expectation of each year’s change, which a year-on-year swap pays. The gap, the convexity adjustment, grows with the start of the year. Data: illustrative sterling curves, Jarrow–Yildirim parameters of ; the chapter’s tutorial.
Figure 11.2. Annual inflation implied by zero-coupon swaps (ratio of forward indices) and the model’s expectation of each year’s change, which a year-on-year swap pays. The gap, the convexity adjustment, grows with the start of the year. Data: illustrative sterling curves, Jarrow–Yildirim parameters of Example 11.5; the chapter’s tutorial.

उदाहरण

Example 11.5 (Sterling year-on-year convexity)

On illustrative sterling curves (SONIA zero rates of 3.6–4.2%, RPI zero-coupon swaps of 3.2–3.4%) with κ=5%\kappa=5\%, σR=80\sigma_R=80 basis points, σI=1.5%\sigma_I=1.5\% and ρ=0.2\rho=0.2, the adjustment is zero for the first year, −1.8-1.8 basis points for the fourth, −15.2-15.2 for the tenth (forward 3.42%, year-on-year expectation 3.27%) and −42.5-42.5 for the nineteenth (Figure 11.2). The ten-year year-on-year swap rate is 3.22% against a ten-year zero-coupon rate of 3.28%. A simulation of the model reproduces the tenth year’s expectation, 1.03268, at 1.03277 with a standard error of 0.00013.

अध्याय में पढ़ें →