All books

Professional

Apps About Coach Log in Start reading

Chemistry · Glossary

What is Calibration curve?

Also known as: least-squares line · residual

Definition 34.9 University Chemistry — Year 2 · Chapter 34 — Statistics of Chemical Measurement

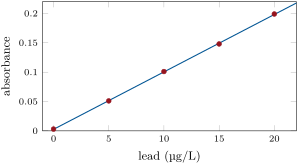
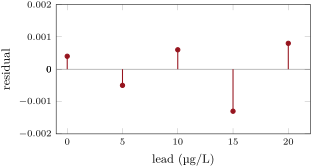
A calibration curve relates the signal yy of an instrument to the concentration xx, from standards of known concentration. The least-squares line y=a+bxy = a + bx is the line that minimises S=∑(yi−a−bxi)2S = \sum (y_i - a - bx_i)^2; each ei=yi−a−bxie_i = y_i - a - bx_i is a residual.

Calibration of lead by graphite-furnace atomic absorption at 283.3\, nm (exercise data, used in the problem). Left: the five standards and the least-squares line. Right: the residuals, small and without pattern: a straight line is adequate. Calibration of lead by graphite-furnace atomic absorption at 283.3\, nm (exercise data, used in the problem). Left: the five standards and the least-squares line. Right: the residuals, small and without pattern: a straight line is adequate.
Calibration of lead by graphite-furnace atomic absorption at 283.3 nm283.3\,\mathrm{nm} (exercise data, used in the problem). Left: the five standards and the least-squares line. Right: the residuals, small and without pattern: a straight line is adequate.
Read in context →