 Coach
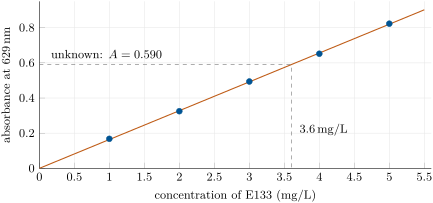
CoachA calibration line is the graph of the absorbance of a series of standard solutions of one species, measured at the same wavelength in the same cell, against their concentration. When the Beer–Lambert law holds, it is a straight line through the origin.
Examples
Example 29.14 (The five standards)
A stock solution of the blue dye at is diluted to give of each standard: for , the dilution factor is 50, so of stock are made up to . The five standards, from 1 to , read 0.168, 0.325, 0.494, 0.652 and 0.823: within a few thousandths of , the line of the figure.