All books

Professional

Apps About Coach Log in Start reading

Chemistry · Glossary

What is Tanabe–Sugano diagram?

Also known as: Tanabe--Sugano diagram

Definition 18.9 University Chemistry — Year 3 · Chapter 18 — Electronic Spectra and Magnetism of Complexes

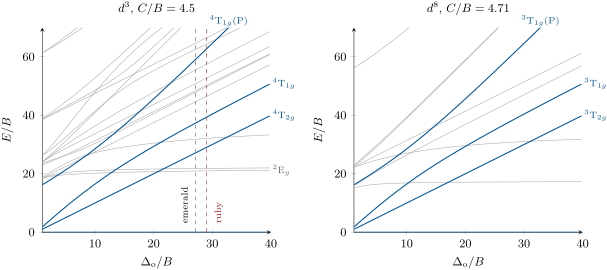
A Tanabe–Sugano diagram plots the energies of all the ligand-field terms of a dnd^n ion, in units of BB and measured from the ground term, against Δo/B\Delta_{\mathrm o}/B, for a fixed ratio C/BC/B.

Tanabe–Sugano diagrams of d3 and d8 ions computed by diagonalising the ligand-field and electron-repulsion Hamiltonian over all the states of the configuration. Thick blue: the states of the ground-state multiplicity (spin-allowed transitions); thin grey: the others. The ground term is the horizontal axis (4A_2g for d3, 3A_2g for d8). Dashed: ruby and emerald, placed at the _ o/B of their two bands. The 2E_g level of d3 is almost flat: its energy hardly depends on the field.
Tanabe–Sugano diagrams of d3d^3 and d8d^8 ions computed by diagonalising the ligand-field and electron-repulsion Hamiltonian over all the states of the configuration. Thick blue: the states of the ground-state multiplicity (spin-allowed transitions); thin grey: the others. The ground term is the horizontal axis (4^4A2g_{2g} for d3d^3, 3^3A2g_{2g} for d8d^8). Dashed: ruby and emerald, placed at the Δo/B\Delta_{\mathrm o}/B of their two bands. The 2^2Eg_g level of d3d^3 is almost flat: its energy hardly depends on the field.
Read in context →