সব বই

পেশাদার

1 Markets I: The Ecosystem and Exchange-Traded Marketsবাজার অনলাইন 2 Markets II: Rates, FX and Creditবাজার অনলাইন 3 Markets III: Commodities, Energy and Cryptoবাজার অনলাইন 4 Quantitative Methodsপদ্ধতি অনলাইন 5 Derivatives and Volatilityডেরিভেটিভস অনলাইন 6 Rates, Credit, XVA and Riskসুদহার, ঋণ ও ঝুঁকি অনলাইন 7 Research Craft: Predictors, Backtests, Measurement, Portfoliosগবেষণা অনলাইন 8 Strategies I: Equities and Futuresকৌশল অনলাইন 9 Strategies II: Volatility, Relative Value, Macro and the Bank Desksকৌশল অনলাইন 10 Microstructure and Executionএক্সিকিউশন অনলাইন 11 Market Making and High-Frequency Tradingমার্কেট মেকিং অনলাইন 12 Machine Learning for Marketsমেশিন লার্নিং অনলাইন 13 Low-Latency Softwareপ্রযুক্তি অনলাইন 14 Networks, Hardware and Trading Infrastructureপ্রযুক্তি অনলাইন 15 Research, Data and Risk Platformsপ্রযুক্তি অনলাইন 16 The Desk and the Firmপ্রতিষ্ঠান অনলাইন 17 The Industry: Firms, Roles and Careersক্যারিয়ার অনলাইন 18 Interviews I: Maths, Probability and Speedক্যারিয়ার অনলাইন 19 Interviews II: Markets, Trading Games and the Final Roundক্যারিয়ার অনলাইন 20 Interviews III: Codeক্যারিয়ার অনলাইন
অ্যাপ পরিচিতি Coach সাইন ইন পড়া শুরু করো

বইগুলো এখনো বাংলা ভাষায় পাওয়া যায় না — ইংরেজি সংস্করণ দেখানো হচ্ছে।

Earth and Space Sciences · পরিভাষা

AFM diagram কী?

Definition 9.5 University Earth and Space Sciences — Year 2 · অধ্যায় 9 — Magmatic Series and Tectonic Settings

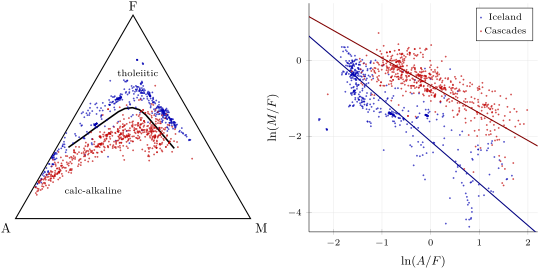
An AFM diagram is a triangular diagram whose corners are A=NaX2O+KX2OA = \ce{Na2O + K2O}, F=FeOXTF = \ce{FeO_T} (all iron as FeO\ce{FeO}) and M=MgOM = \ce{MgO}, in mass per cent recalculated so that A+F+M=100A + F + M = 100. A line drawn on it separates the tholeiitic field, on the side of F, from the calc-alkaline field.

Left: the AFM diagram of the Icelandic (blue) and Cascades (red) rocks of the TAS figure, with the dividing line of Irvine and Baragar (1971). Right: the same rocks in log-ratio coordinates, where each series becomes a nearly straight band; the lines are orthogonal regressions, of slopes -1.10 (Iceland) and -0.72 (Cascades), meeting at (-3.84, 2.12) as Vermeesch and Pease (2021) found.
Left: the AFM diagram of the Icelandic (blue) and Cascades (red) rocks of the TAS figure, with the dividing line of Irvine and Baragar (1971). Right: the same rocks in log-ratio coordinates, where each series becomes a nearly straight band; the lines are orthogonal regressions, of slopes −1.10-1.10 (Iceland) and −0.72-0.72 (Cascades), meeting at (−3.84,2.12)(-3.84, 2.12) as Vermeesch and Pease (2021) found.
প্রসঙ্গসহ পড়ো →