全部书籍

专业

应用 关于 Coach 登录 开始阅读

书籍暂未推出简体中文版——当前显示英文版。

Earth and Space Sciences · 术语表

什么是 AFM diagram?

Definition 9.5 University Earth and Space Sciences — Year 2 · 第 9 章 — Magmatic Series and Tectonic Settings

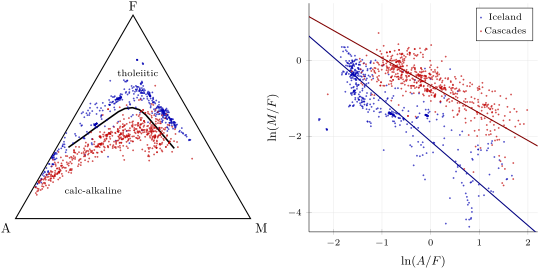
An AFM diagram is a triangular diagram whose corners are A=NaX2O+KX2OA = \ce{Na2O + K2O}, F=FeOXTF = \ce{FeO_T} (all iron as FeO\ce{FeO}) and M=MgOM = \ce{MgO}, in mass per cent recalculated so that A+F+M=100A + F + M = 100. A line drawn on it separates the tholeiitic field, on the side of F, from the calc-alkaline field.

Left: the AFM diagram of the Icelandic (blue) and Cascades (red) rocks of the TAS figure, with the dividing line of Irvine and Baragar (1971). Right: the same rocks in log-ratio coordinates, where each series becomes a nearly straight band; the lines are orthogonal regressions, of slopes -1.10 (Iceland) and -0.72 (Cascades), meeting at (-3.84, 2.12) as Vermeesch and Pease (2021) found.
Left: the AFM diagram of the Icelandic (blue) and Cascades (red) rocks of the TAS figure, with the dividing line of Irvine and Baragar (1971). Right: the same rocks in log-ratio coordinates, where each series becomes a nearly straight band; the lines are orthogonal regressions, of slopes −1.10-1.10 (Iceland) and −0.72-0.72 (Cascades), meeting at (−3.84,2.12)(-3.84, 2.12) as Vermeesch and Pease (2021) found.
在原文中阅读 →