书籍暂未推出简体中文版——当前显示英文版。
University Earth and Space Sciences — Year 2 · 本科二年级
9Magmatic Series and Tectonic Settings
Hand a petrologist a chemical analysis and no map, and she can often say whether the lava erupted at a ridge, on an ocean island or above a subducting plate. The lavas of Iceland and those of the Cascade volcanoes of western North America both run from basalt to rhyolite; analysed by the hundred, they follow two different paths as they evolve, one growing ever richer in iron, the other not. This chapter first names igneous rocks, from their minerals when they can be seen and from their chemistry when they cannot; it then groups them into series, families of rocks related by differentiation, and ties each series to a tectonic setting, with the diagrams that petrologists use to read a setting from an analysis, and their limits.
You already know
From the high-school volume: basalt, andesite, rhyolite, gabbro and granite; felsic and mafic rocks; volcanic and plutonic textures. From the Year 1 volume: mid-ocean ridges, subduction zones and volcanic arcs, hotspots and large igneous provinces, continental rifts. From Chapter 3: MORB and OIB, primitive-mantle-normalised (spider) diagrams, compatible and incompatible elements. From Chapter 4: the depleted mantle and the enriched isotopic reservoirs. From Chapter 8: fractional crystallisation, the liquid line of descent, Harker diagrams and the Rayleigh law.
9.1 Naming igneous rocks
A coarse-grained rock shows its minerals, and is named from them. A lava is often too fine-grained or too glassy for that, and is named from its chemical analysis. Both schemes are international conventions: they describe, and imply nothing about how the rock formed.
Definition 9.1 (Modal composition; QAPF diagram)
The modal composition of a rock is the proportion by volume of each of its minerals. The QAPF diagram names a coarse-grained igneous rock with less than of mafic minerals from four modal components recalculated to a sum of 100: quartz (Q), alkali feldspar (A), plagioclase (P) and the feldspathoids (F). Since quartz and feldspathoids do not crystallise together, every rock plots in one of two triangles, QAP or FAP, joined along their common side AP.
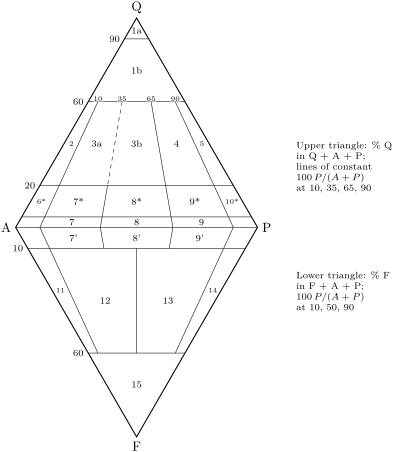
Field 10 holds three names. The QAPF diagram does not separate diorite, gabbro and anorthosite, nor the gabbroic rocks among themselves; further diagrams, based on the plagioclase and the mafic minerals, do that.
Definition 9.2 (Total alkali–silica diagram)
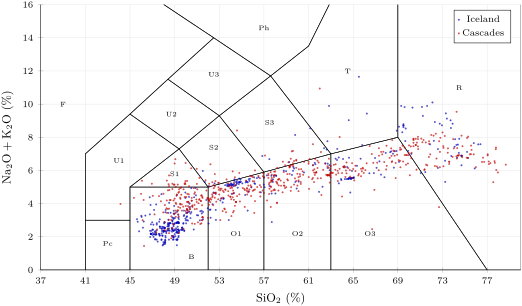
The total alkali–silica diagram (TAS diagram) names a volcanic rock whose mode cannot be measured from its mass percentages of against , after the analysis has been recalculated to free of water and carbon dioxide. It is divided into fifteen fields by straight lines whose intersections have fixed coordinates (the figure after the next paragraph).
The diagram has three groups of fields. Along the bottom, at low alkalis, lie the names of the common series, picrobasalt and basalt to rhyolite, separated at 45, 52, 57 and silica and, for rhyolite, by a sloping line. Above them, the S fields and trachyte hold rocks richer in alkalis at the same silica; the U fields, phonolite and foidite hold rocks so rich in alkalis, and so poor in silica, that they crystallise feldspathoids. A few fields are subdivided by a second criterion: a trachybasalt is called hawaiite if , potassic trachybasalt otherwise; a tephrite with more than olivine in its norm (below) is a basanite; a rhyolite or a trachyte whose molecular exceeds 1 is called peralkaline. The scheme asks for analyses with less than water and carbon dioxide: alteration adds water and moves the alkalis, and a cumulate is not a liquid.
Definition 9.3 (Silica saturation)
A magma or rock is silica-oversaturated if it has more silica than its other oxides can combine with in silicate minerals, so that quartz (or another silica mineral) appears; silica-undersaturated if it has too little to turn all its alkalis into feldspar, so that a feldspathoid (nepheline, leucite) appears instead, never together with quartz; and silica-saturated between the two.
For a lava whose minerals cannot be counted, saturation is judged on a norm: a standard calculation that distributes the oxides of the analysis among ideal minerals in a fixed order, alkalis into feldspar first, and reports the excess silica as quartz or the shortfall as feldspathoid. The usual one, the CIPW norm, separates the two kinds of basalt: a basalt with nepheline in its norm is an alkali basalt; one without is a subalkali basalt, and among these the tholeiitic basalts carry hypersthene (orthopyroxene) in the norm and, often, low-calcium pyroxene in the mode. Exercise 9.11 runs a simplified version of it.
9.2 Magmatic series
Lavas from one volcano, or one province, are seldom alike, but they are related: they derive from similar parent magmas by the differentiation of Chapter 8, and they trace together a line of descent.
Definition 9.4 (Magmatic series)
A magmatic series is a suite of igneous rocks of one magmatic cycle or province related by differentiation from similar parent magmas and sharing characteristic chemical and mineralogical features. Three are commonly distinguished. The tholeiitic series starts from basalts saturated or slightly oversaturated in silica, with hypersthene in the norm, and shows a marked enrichment in iron at the start of its differentiation. The calc-alkaline series runs from basalt through andesite to dacite and rhyolite, with little or no enrichment in iron, and with hydrous minerals (hornblende, biotite) in its evolved members. The alkaline series starts from nepheline-normative basalts and evolves through the S and U fields of the TAS diagram towards trachyte and phonolite.
The names describe suites, not single rocks: an isolated basalt can belong to any of them, and the same names have been used with different meanings, so a petrologist must say what she means by them. The distinction between the tholeiitic and calc-alkaline series rests on iron, and the diagram that shows it best plots three groups of oxides.
Definition 9.5 (AFM diagram)
An AFM diagram is a triangular diagram whose corners are , (all iron as ) and , in mass per cent recalculated so that . A line drawn on it separates the tholeiitic field, on the side of F, from the calc-alkaline field.
A differentiating basalt loses magnesium faster than anything else, since olivine and pyroxene are richer in magnesium than the liquid, and keeps its alkalis, which are incompatible: its line of descent moves away from M, towards A. What happens to iron decides the series. In a tholeiitic magma iron leaves only with the magnesium-rich ferrous silicates, more slowly than magnesium, so that the ratio rises and the trend first climbs towards F before turning to A: the Fenner trend. In a calc-alkaline magma, more oxidised, iron also leaves in magnetite, which holds ferric iron, and stays nearly constant as the liquid moves straight towards A: the Bowen trend. The figure below shows both with real rocks, Iceland’s tholeiites and the calc-alkaline lavas of the Cascades. The dividing line, drawn by eye in 1971, separates them well where they are basaltic; at high alkalis the two trends converge and the line says little.
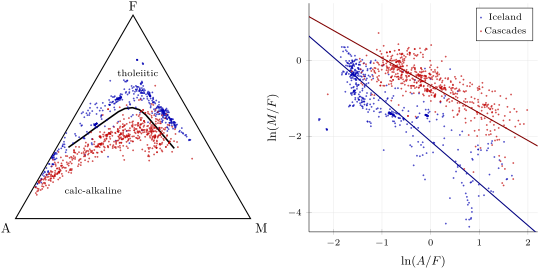
Of the Icelandic rocks within the range of the dividing line, 351 fall on the tholeiitic side and 23 on the other; of the Cascades rocks, 417 on the calc-alkaline side and 57 on the other. A curve is a clumsy boundary, and a simple model explains the shape of the trends. Suppose that a magma loses its alkalis, iron and magnesium at rates proportional to the amounts it holds, .
Proposition 9.6 (Log-ratio trends)
If , and decay exponentially with constants , and , the magma moves along a straight line in the plane of and , of slope , while it moves along a curve on the AFM triangle.
Proof. With , and : both are linear in , so one is linear in the other, with the slope stated. The ratios and fix the point on the triangle, whose coordinates , … are not linear in . ∎
The steeper slope of the Icelandic rocks means a smaller : iron leaves the tholeiitic magma more slowly (Exercise 9.10). Vermeesch and Pease showed that the two bands of the figure above meet at one point, which they read as a hypothetical common source.
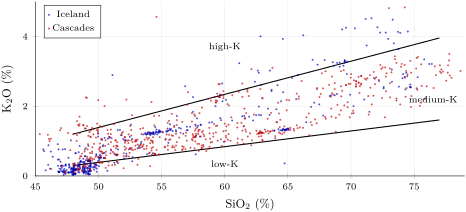
The tholeiitic and calc-alkaline series differ in their potash as well. The – diagram divides basalts, andesites, dacites and rhyolites with more than silica into low-K, medium-K and high-K types by two straight lines (the figure below). Most of both suites here are medium-K: the diagram says how much potash a series carries, not which series it is.
Why does oxidation differ? Calc-alkaline magmas form above subduction zones, where the dehydrating slab supplies oxidised species to the mantle wedge; the magmas crystallise magnetite, and their evolved members hornblende or biotite. Tholeiitic magmas form at ridges, where the mantle melts by decompression (Chapter 7), and are more reduced.
9.3 Series and settings
Each setting of plate tectonics produces its own magmas, because each melts the mantle in its own way: by decompression beneath ridges and hotspots, by adding water above subduction zones (Chapter 7).
Mid-ocean ridges erupt tholeiitic basalts, the MORB of Chapter 3, poor in incompatible elements and with the depleted isotopic signature of their source. Iceland, a ridge over a hotspot, adds its own tholeiites to that list, with a full suite to rhyolite.
Ocean islands grow in stages. A Hawaiian volcano erupts alkalic lavas while young, then builds its shield of tholeiitic basalt, an estimated 80 to of its final volume, within its first 1 to 2 million years; as it drifts away from the hotspot its lavas become alkalic again, ending in a long tail of rare alkalic eruptions. Less melting gives more alkaline magmas: the alkalis, being incompatible, are diluted less in a small melt fraction. Isotopically, ocean-island basalts sample the enriched reservoirs of Chapter 4.
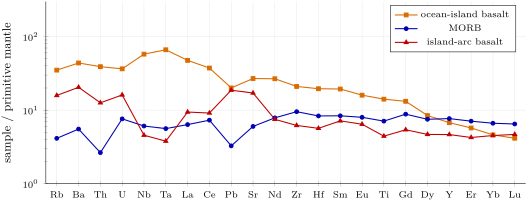
Volcanic arcs erupt calc-alkaline series. Their trace elements carry a distinctive mark (the figure below): normalised to the primitive mantle, the arc basalts are enriched in Rb, Ba, Th, U, Pb and Sr, elements that the slab adds to the wedge, and depleted in niobium and tantalum relative to their neighbours. The median arc basalt of the data set has , against 0.97 for MORB and 1.23 for ocean-island basalts.
Within continents, basaltic magma meets a thick crust that it can heat and melt, and the result can be a volcanism with two modes.
Definition 9.7 (Bimodal volcanism)
Bimodal volcanism is the eruption, in one province, of two groups of magmas, basaltic and rhyolitic, with few intermediate compositions between them.
The volcanism along the track of the Yellowstone hotspot is bimodal: on the Eastern Snake River Plain, older rhyolites with some silica are covered by younger basalts with some . The gap between them is the clue: the differentiation of a basalt alone would have left intermediate lavas behind, and a gap points to a second source for the rhyolites, such as the crust that the basalt heats.
Large igneous provinces, met in the Year 1 volume, erupt basalt in volumes no other setting matches; their series is read with the same diagrams.
9.4 Discrimination diagrams
The patterns of the previous section suggest reading a setting from an analysis directly, and petrologists have drawn many diagrams to do so.
Definition 9.8 (Discrimination diagram)
A discrimination diagram is a diagram of chemical variables, usually immobile trace elements, divided into fields drawn around the compositions of rocks from known settings, used to assign a setting to a rock of unknown origin.
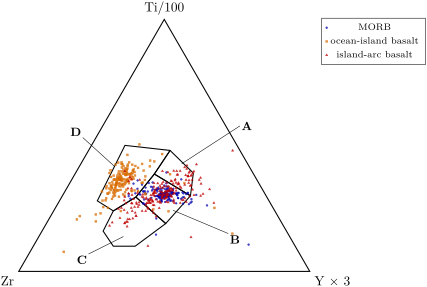
The classic is the Ti–Zr–Y triangle of Pearce and Cann (1973), drawn for basalts. It uses elements little moved by alteration, so that it can be applied to old, metamorphosed lavas whose setting is lost. The figure below tests it on the 538 basalts of the compilation that have all three elements. Most ocean-island basalts fall in the within-plate field D, 152 of 173, and most MORB in field B, 142 of 164; but field B is shared with arc basalts, and 101 of the 201 arc basalts fall there too.
Method 9.9 (Using a discrimination diagram)
(1) Check that the rock is of the kind the diagram was built for, usually a basalt, and not a cumulate or an evolved lava, whose trace elements reflect crystallisation as much as the source. (2) Prefer elements immobile in alteration (Ti, Zr, Y, Nb, the heavy rare earths) for altered or metamorphosed rocks. (3) Plot a suite of samples, not one: a single point near a boundary decides nothing. (4) Read the result as a likelihood: the fields were drawn around most, not all, of their reference samples, and some fields are shared. (5) Confirm with independent evidence: other diagrams, isotopes, the geological context.
Step (4) can be made quantitative (Exercise 9.8). If a basalt falls in field B, and the three settings were equally common, the chance that it is a MORB is only about 0.62. Statistical classifiers trained on such compilations inherit the same limit: a basalt carries the memory of its source and its melting, and two settings can make similar magmas.
In the lab — Checking a whole-rock analysis
Before plotting a rock on any of these diagrams, petrologists check the analysis. The major oxides, measured for instance by X-ray fluorescence, should add up close to 100 with the volatiles: water and carbon dioxide, measured directly or together as the loss on ignition, the mass a powder loses on strong heating. A large loss on ignition marks an altered rock, whose alkalis may have moved; the scheme of the TAS diagram rejects analyses with more than water or carbon dioxide. Analyses are then recalculated to 100 free of volatiles, iron is expressed as total or split between ferrous and ferric, and reference materials analysed in the same run are compared with their certified values (Chapter 31).
9.5 Exercises
Exercise 9.1 ★
Name the following volcanic rocks on the TAS diagram (, , in , already volatile-free): (a) 49.60, 2.22, 0.51 (the Hawaiian reference basalt BHVO-2); (b) 58.5, 3.9, 1.6; (c) 72.0, 4.0, 4.2; (d) 47.0, 4.5, 2.5. For (d), name the two possible rocks and say what decides between them.
Solution
Solution of Exercise 9.1.
(a) , alkalis : between 45 and 52 and below 5, basalt (B). (b) 58.5 and : between 57 and 63; the upper boundary there runs from (57, 5.9) to (63, 7.0), at for 58.5; 5.5 lies below it: andesite (O2). (c) 72.0 and : beyond the vertical at 69 above 8 and above the line from (69, 8) to (77, 0), which is at 5.0 for 72: rhyolite (R). (d) 47.0 and : at 47 the field U1 lies between the line from (45, 5) to (49.4, 7.3), at , and the line from (45, 9.4) to (49.4, 7.3), at . The rock is in U1: a tephrite if its norm holds less than olivine, a basanite if more.
Exercise 9.2 ★
A lava gives 51.60, 1.20, 16.10, 9.80, 6.60, 8.20, 3.50, 1.40, 1.40 and . (a) Is the analysis acceptable for the TAS diagram? (b) Recalculate it free of volatiles. (c) Name the rock before and after the recalculation. (d) Is it low-, medium- or high-K?
Solution
Solution of Exercise 9.2.
(a) The oxides add up to 98.40 and the total with volatiles to 100.00; and : the analysis is acceptable. (b) Factor : 52.44, 1.22, 16.36, 9.96, 6.71, 8.33, 3.56, 1.42 (sum 100.00); alkalis . (c) Before: 51.60 and 4.90, just below the basalt–basaltic andesite boundary at 52: basalt. After: 52.44 and 4.98; at 52.44 the upper boundary of O1, from (52, 5) to (57, 5.9), is at : basaltic andesite (O1). The recalculation moved the rock across a boundary: names near a line depend on it. (d) At 52.44 the low-K line is at and the high-K line at ; 1.42 lies between: medium-K.
Exercise 9.3 ★
Name on the QAPF diagram: (a) a coarse-grained rock with quartz, alkali feldspar, plagioclase, biotite and hornblende; (b) one with quartz, alkali feldspar, plagioclase and clinopyroxene.
Solution
Solution of Exercise 9.3.
(a) : and : field 3b, a monzogranite, a granite. Biotite and hornblende do not enter the QAPF sum. (b) : (between 5 and 20) and (above 90): field 10*, quartz diorite, quartz gabbro or quartz anorthosite. The QAPF diagram alone does not choose among them; the plagioclase and the mafic minerals (here clinopyroxene) do.
Exercise 9.4 ★
Classify as low-, medium- or high-K, with the lines of the – figure: (a) 50.0, 0.40; (b) 56.0, 1.50; (c) 62.0, 2.90; (d) 66.0, 1.00 (, , ).
Solution
Solution of Exercise 9.4.
The low-K line is , the high-K line . (a) At 50: 0.39 and 1.39; is just above the low line: medium-K. (b) At 56: 0.66 and 1.96: medium-K. (c) At 62: 0.93 and 2.53; : high-K. (d) At 66: 1.11 and 2.91; : low-K.
Exercise 9.5 ★★
(a) Compute , and for a basalt with 14.5, 4.5 and , and for an andesite with 6.1, 3.8 and 5.05. (b) The dividing line passes through , and , the first being its most iron-rich point; the tholeiitic side is the side of F. On which side does each rock fall? (c) Which mineral, crystallising early, keeps the andesite where it is?
Solution
Solution of Exercise 9.5.
(a) Basalt: ; , , . Andesite: ; , , . (b) The line never reaches beyond ; the basalt, with , lies on the side of F whatever its : tholeiitic, a ferrobasalt of a Fenner trend. For the andesite, at the line lies between (49.6, 35.0) and (52.5, 30.0), at ; : calc-alkaline. (c) Magnetite, which carries ferric iron out of an oxidised magma from early on and keeps from rising as fast as in a tholeiite.
Exercise 9.6 ★★
The median MORB of the compilation has Nb and La, the median ocean-island basalt 38 and 30.8, the median arc basalt 3 and 6.1. With the primitive mantle values Nb 0.658 and La , compute the normalised values and for each. Which has a niobium anomaly, and why?
Solution
Solution of Exercise 9.6.
MORB: , , ratio 0.956. Ocean-island basalt: , , ratio 1.215. Arc basalt: , , ratio 0.484. Only the arc basalt has a niobium anomaly, a trough at Nb on a spider diagram: niobium is depleted relative to its neighbour La: the arc magma received elements from the slab, but little niobium. MORB is nearly flat; the ocean-island basalt is richer in Nb than in La.
Exercise 9.7 ★★
Ti is of the mass of . Compute the Ti–Zr–Y plot coordinates (Ti/100, Zr, , recast to 100) of three basalts: (a) , Zr 110, Y ; (b) 2.8, 220, 29; (c) 0.8, 50, 20. Locate them on the figure and say what each placement allows you to conclude.
Solution
Solution of Exercise 9.7.
(a) ; Ti/100 = 95.9, Zr 110, ; sum 301.9; coordinates 31.8, 36.4, 31.8: field B. (b) Ti 16 780, so 167.8, 220, 87; sum 474.8; 35.3, 46.3, 18.3: field D. (c) Ti 4794, so 47.9, 50, 60; sum 157.9; 30.3, 31.7, 38.0: field B. Basalt (b) is a within-plate basalt (of an ocean island or a continent); (a) and (c), in field B, may be MORB, arc tholeiites or calc-alkali basalts: the diagram cannot decide, and another one (a spider diagram, the Nb anomaly) is needed.
Exercise 9.8 ★★
In the Ti–Zr–Y test of this chapter, field B holds 142 of 164 MORB, 4 of 173 ocean-island basalts and 101 of 201 arc basalts. (a) What fraction of each group falls in B? (b) If the three settings were equally common, what is the probability that a basalt plotting in B is a MORB? (c) What does field B alone allow you to say?
Solution
Solution of Exercise 9.8.
(a) MORB , ocean-island basalts , arc basalts . (b) With equal priors, Bayes’ rule gives . (c) That the basalt is very unlikely to be an ocean-island basalt (probability ), but not whether it is a MORB or an arc basalt: roughly three chances in five against two.
Exercise 9.9 ★★
A rhyolite has 5.5, 4.5 and ( = 61.98, 94.20 and ). Compute its molecular . (a) Is it peralkaline? (b) Alkali feldspar holds one alkali oxide per : what fraction of the alkalis cannot enter it?
Solution
Solution of Exercise 9.9.
Moles per : , , . (a) : the rhyolite is peralkaline. (b) Feldspar can take of the moles of alkali oxide; the excess, , is , a quarter of the alkalis, which must enter other minerals.
Exercise 9.10 ★★★
In the model of the log-ratio proposition, take and . (a) Compute the slope of the trend for and for . (b) The Icelandic rocks have a slope of and those of the Cascades : what does each imply? (c) Which series loses its iron faster, and which mineral explains it? (d) What happens to along each trend?
Solution
Solution of Exercise 9.10.
(a) : for , ; for , . (b) Solving gives : Iceland, : ; Cascades, : . (c) The Cascades magma, with the larger , loses its iron faster: magnetite takes it out. (d) grows at the rate and at the rate ; so for each unit gained by , gains : 1.10 in Iceland, 0.72 in the Cascades. rises along both trends, but faster in the tholeiitic one, the Fenner trend.
Exercise 9.11 ★★★
A simplified norm. Work in moles of oxide. Put all into orthoclase (), all into albite (), the remaining with as much into anorthite (), the remaining with as much into diopside () and the rest of into hypersthene (). If silica is short, turn hypersthene into olivine (); if it is still short, turn albite into nepheline (). Apply it to (a) BHVO-2: 49.60, 13.44, 11.15, 7.257, 11.40, 2.219, ; (b) a basalt with 45.5, 15.0, 11.5, 8.5, 10.0, 3.8 and 1.5 (molar masses 60.08, 101.96, 71.84, 40.30, 56.08, 61.98, ). Is each silica-saturated? To which series does each basalt belong?
Solution
Solution of Exercise 9.11.
(a) BHVO-2, moles per : 0.82557, 0.13182, 0.15521, 0.18007, 0.20328, 0.03580, 0.00545. Orthoclase 0.00545 and albite 0.03580; left , all into anorthite with as much ; left into diopside; left into hypersthene. Silica needed: ; available 0.82557; short by 0.05106. Each turned from hypersthene into olivine saves half a silica, at most : turning of it is enough, and stays in hypersthene. The norm holds olivine and hypersthene, and neither quartz nor nepheline: the rock is silica-saturated in the sense of the definition, a hypersthene-normative olivine tholeiite, of the tholeiitic series, as the shield stage of a Hawaiian volcano erupts. (b) Moles: 0.75732, 0.14712, 0.16008, 0.21092, 0.17832, 0.06131, 0.01592. Or 0.01592, ab 0.06131, an 0.06988, di 0.10843, hy ; silica needed ; available 0.75732; short by 0.32525. All the hypersthene turned into olivine saves 0.13129, leaving 0.19396; each mole of turned from albite into nepheline frees 4 , so of the 0.06131 moles of albite become nepheline. Nepheline in the norm: the rock is silica-undersaturated, an alkali basalt, of the alkaline series.
Exercise 9.12 ★★★
In the compilation, holds for 116 of 141 arc basalts, 21 of 101 MORB and 3 of 137 ocean-island basalts analysed for both. (a) Compute the three fractions. (b) With equal proportions of the three settings, what is the probability that a basalt with is an arc basalt? (c) Redo it for a region where of basalts are MORB, ocean-island basalts and arc basalts. (d) What lesson does (c) hold for the use of discrimination diagrams?
Solution
Solution of Exercise 9.12.
(a) Arc basalts , MORB , ocean-island basalts . (b) . (c) Numerator ; denominator ; probability . (d) The same test on the same rock gives 0.78 or 0.39 depending on how common each setting is where the rock was found: a discrimination diagram gives a likelihood, and the geological context must supply the rest.
9.6 Problem: One volcano, three lavas
Problem 9.1
Weekend problem — from three analyses to the setting of a volcano and the crystals it left behind
Three lavas of an (invented) stratovolcano, from its oldest flank flows to its youngest dome, give ():
| lava 1 | 50.4 | 0.95 | 17.6 | 8.6 | 7.9 | 10.2 | 2.9 | 0.62 | 0.70 | 0.10 |
| lava 2 | 58.6 | 0.80 | 17.4 | 6.1 | 3.8 | 6.9 | 3.9 | 1.15 | 1.10 | 0.05 |
| lava 3 | 65.3 | 0.55 | 16.2 | 4.0 | 1.6 | 4.3 | 4.4 | 1.85 | 1.20 | 0.05 |
and in ppm: Rb 10, 20, 32; Th 1.1, 2.1, 3.4; Nb 2.0, 3.6, 5.6; La 7, 13, 20; Sr 520, 480, 380; Zr 70, 125, 190; Y 18, 22, 24. Primitive mantle: Nb 0.658, La 0.648, Th .
Part I — Naming the lavas.
- Add up each analysis. Are the three acceptable for the TAS diagram?
- Recalculate lava 1 free of volatiles: give the factor, and .
- Do the same for lavas 2 and 3.
- Name the three lavas on the TAS diagram.
- Would the names change without the recalculation?
- A coarse-grained rock of the composition of lava 2 crystallised in the volcano’s roots. Which scheme names it, and in which field would you expect it?
Part II — Which series?
- Classify each lava as low-, medium- or high-K.
- Compute , , for each (volatile-free).
- The dividing line passes through , , , , and , with the tholeiitic field on the side of F. Interpolating linearly in between neighbouring points, on which side does each lava fall?
- Compute / for each lava. Is there an iron enrichment?
- To which series does the volcano belong? Which mineral and which conditions explain it?
Part III — Which setting?
- Normalise Nb, La and Th of lava 1 to the primitive mantle.
- Compute for lava 1 and compare it with the medians of Exercise 9.6.
- Compute . What carried the thorium?
- Compute the Ti–Zr–Y coordinates of lava 1 ( of the volatile-free analysis). What does its field say? Why not plot lavas 2 and 3?
- Conclude: where did this volcano grow?
Part IV — How much crystallised?
- Potash enters none of the early minerals. From the volatile-free of lavas 1 and 2, compute the fraction of liquid left when lava 2 formed, if it derives from lava 1 by fractional crystallisation.
- Do the same with rubidium and with thorium.
- Zirconium has a bulk . Use the Rayleigh law to estimate from it.
- Strontium falls from lava 2 to lava 3. Compute from potash between lavas 2 and 3, and use it to estimate the bulk of Sr over that interval. Which mineral is responsible?
- From lava 1 to lava 3, what fraction of the liquid crystallised?
- If the magma had assimilated granitic crust rich in potash, would the potash estimate be too high or too low?
- Average the four estimates of Part IV for lavas 1 to 2 and state the mass of crystals left behind per of basalt to make the andesite, the key number of this problem.
Solution
Solution of Problem 9.1.
Part I.
1. Oxides: lava 1 99.17, lava 2 98.65, lava 3 98.20; with the volatiles 99.97, 99.80 and 99.45, all close to 100. Water (0.70, 1.10, 1.20) is below and carbon dioxide (0.10, 0.05, 0.05) below : all three are acceptable.
2. Factor : 50.82, 2.92, 0.63, alkalis 3.55.
3. Lava 2: , 59.40, 3.95, 1.17, alkalis 5.12. Lava 3: , 66.50, 4.48, 1.88, alkalis 6.36.
4. Lava 1 (50.82, 3.55): basalt. Lava 2 (59.40, 5.12; the O2 upper boundary there is at ): andesite. Lava 3 (66.50, 6.36; between 63 and the line from (69, 8) to (77, 0), below the line from (63, 7) to (69, 8)): dacite.
5. Raw: (50.4, 3.52), (58.6, 5.05), (65.3, 6.25): the same fields. The recalculation moves each point by at most silica and changes nothing here, unlike Exercise 9.2.
6. The QAPF diagram, from the measured mode. A plutonic rock of andesitic composition is rich in plagioclase, with little alkali feldspar or quartz: it should fall in field 10 or 10*, a diorite or quartz diorite (its mode decides).
Part II.
7. Lava 1: lines at 0.43 and 1.47, : medium-K. Lava 2: 0.81 and 2.28, 1.17: medium-K. Lava 3: 1.13 and 2.96, 1.88: medium-K.
8. Volatile-free and : 8.67 and 7.97; 6.18 and 3.85; 4.07 and 1.63. Lava 1: ; , , . Lava 2: 15.15; 33.8, 40.8, 25.4. Lava 3: 12.06; 52.7, 33.7, 13.5.
9. Lava 1, : the line between (42.8, 17.1) and (46.9, 18.1) is at ; , calc-alkaline side, close to the line. Lava 2, : ; , calc-alkaline. Lava 3, : ; , calc-alkaline.
10. : , , . The ratio rises, as it does in every differentiating basalt, but iron itself falls from 8.67 to 4.07, and falls on the triangle from 42.9 to 33.7: no iron enrichment. A tholeiitic suite would first climb towards F, as the ferrobasalt of Exercise 9.5 does.
11. The calc-alkaline series. Magnetite, crystallising from an oxidised magma, removed iron with magnesium; the oxidised species come from the dehydrating slab of a subduction zone.
Part III.
12. , , .
13. , well below the medians of MORB (0.956) and ocean-island basalts (1.215), and below even the median arc basalt (0.484): a deep niobium trough.
14. ; the median MORB of the spider diagram has . Thorium, like the other elements enriched in arc basalts, was added by the subducting slab.
15. volatile-free ; ; Ti/100 = 57.4, Zr 70, , sum 181.4: 31.6, 38.6, 29.8, in field B, shared by MORB, arc tholeiites and calc-alkali basalts. It excludes a within-plate basalt but does not decide between a ridge and an arc. The diagram was built for basalts: in an andesite and a dacite, titanium has been removed by the oxides and zirconium concentrated by crystallisation, and their fields (lava 2 would fall in C, lava 3 outside every field) would mean nothing.
16. A calc-alkaline, medium-K series, with a deep niobium trough and high , on a volcano that erupted basalt to dacite: the volcano grew in a volcanic arc above a subduction zone.
Part IV.
17. for a perfectly incompatible element: .
18. Rubidium ; thorium . (The trace elements, given as analysed, would change by less than with the recalculation.)
19. : , .
20. From potash, from lava 2 to lava 3. Strontium: , so and : strontium has become compatible. Plagioclase, which takes strontium in, was crystallising in abundance.
21. From potash, (rubidium , thorium ): about two thirds of the basalt, , crystallised before the dacite.
22. Assimilated potash would raise in lava 2 above what crystallisation alone gives, so would come out too low, and the mass of crystals too high.
23. ; crystals of the basalt, that is of crystals per of basalt to make the andesite.