
সব বই

পেশাদার

1 Markets I: The Ecosystem and Exchange-Traded Marketsবাজার অনলাইন 2 Markets II: Rates, FX and Creditবাজার অনলাইন 3 Markets III: Commodities, Energy and Cryptoবাজার অনলাইন 4 Quantitative Methodsপদ্ধতি অনলাইন 5 Derivatives and Volatilityডেরিভেটিভস অনলাইন 6 Rates, Credit, XVA and Riskসুদহার, ঋণ ও ঝুঁকি অনলাইন 7 Research Craft: Predictors, Backtests, Measurement, Portfoliosগবেষণা অনলাইন 8 Strategies I: Equities and Futuresকৌশল অনলাইন 9 Strategies II: Volatility, Relative Value, Macro and the Bank Desksকৌশল অনলাইন 10 Microstructure and Executionএক্সিকিউশন অনলাইন 11 Market Making and High-Frequency Tradingমার্কেট মেকিং অনলাইন 12 Machine Learning for Marketsমেশিন লার্নিং অনলাইন 13 Low-Latency Softwareপ্রযুক্তি অনলাইন 14 Networks, Hardware and Trading Infrastructureপ্রযুক্তি অনলাইন 15 Research, Data and Risk Platformsপ্রযুক্তি অনলাইন 16 The Desk and the Firmপ্রতিষ্ঠান অনলাইন 17 The Industry: Firms, Roles and Careersক্যারিয়ার অনলাইন 18 Interviews I: Maths, Probability and Speedক্যারিয়ার অনলাইন 19 Interviews II: Markets, Trading Games and the Final Roundক্যারিয়ার অনলাইন 20 Interviews III: Codeক্যারিয়ার অনলাইন
অ্যাপ পরিচিতি Coach সাইন ইন পড়া শুরু করো

বইগুলো এখনো বাংলা ভাষায় পাওয়া যায় না — ইংরেজি সংস্করণ দেখানো হচ্ছে।

Earth and Space Sciences · পরিভাষা

Checkerboard test কী?

Definition 1.17 University Earth and Space Sciences — Year 3 · অধ্যায় 1 — Seismology and Earth Imaging

A checkerboard test is a resolution test in which the synthetic model is a regular pattern of alternately fast and slow cells: synthetic residuals computed through the real ray geometry, with noise of the size of the real errors, are inverted with the same parametrisation and damping. Where the pattern is recovered, structures of that size can be resolved; where it is smeared or lost, they cannot.
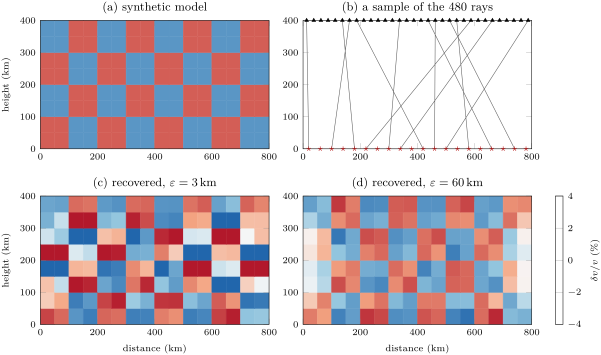
A checkerboard test (invented geometry). (a) The synthetic model: blocks 100\, km across, 3\,\% fast (blue) or slow (red). (b) The 20 sources (stars), the 32 stations (triangles) and some of the rays, all within 45 of the vertical. (c) With light damping the blocks are found, but noisy, with anomalies up to about 8\,\% where few rays cross (colours saturate at 4\,\%). (d) With heavy damping the pattern is clean, but its amplitude is reduced, most of all along the side edges, where few rays cross and all at similar angles.
A checkerboard test (invented geometry). (a) The synthetic model: blocks 100 km100\,\mathrm{km} across, 3 %3\,\% fast (blue) or slow (red). (b) The 20 sources (stars), the 32 stations (triangles) and some of the rays, all within 45∘45{}^{\circ} of the vertical. (c) With light damping the blocks are found, but noisy, with anomalies up to about 8 %8\,\% where few rays cross (colours saturate at 4 %4\,\%). (d) With heavy damping the pattern is clean, but its amplitude is reduced, most of all along the side edges, where few rays cross and all at similar angles.
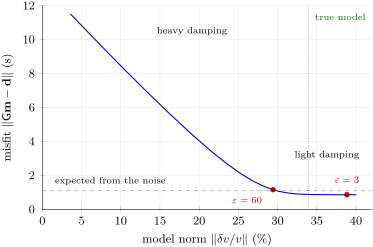
The trade-off curve of the checkerboard test, for damping values  from 0.1 to 1000\, km (the kernel is in kilometres, with equal errors). Along the flat part, more damping costs almost no fit: the model shrinks by losing noise. The knee lies where the misfit rises through the level expected from the noise alone, √480 = 1.095\, s; the two damped models of the previous figure lie on either side of it, and the norm of the true checkerboard, 33.9\,\%, between them. Beyond the knee the damping removes structure the data require.
The trade-off curve of the checkerboard test, for damping values ε\varepsilon from 0.1 to 1000 km1000\,\mathrm{km} (the kernel is in kilometres, with equal errors). Along the flat part, more damping costs almost no fit: the model shrinks by losing noise. The knee lies where the misfit rises through the level expected from the noise alone, σ480=1.095 s\sigma\sqrt{480} = 1.095\,\mathrm{s}; the two damped models of the previous figure lie on either side of it, and the norm of the true checkerboard, 33.9 %33.9\,\%, between them. Beyond the knee the damping removes structure the data require.
প্রসঙ্গসহ পড়ো →