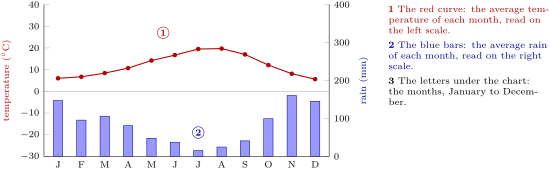
A climate chart shows, for each month of the year, the average temperature of a place (a curve) and the average amount of rain and snow that falls there (bars, in millimetres of water).
 Coach
登录
开始阅读
书籍暂未推出简体中文版——当前显示英文版。
Earth and Space Sciences · 术语表
A climate chart shows, for each month of the year, the average temperature of a place (a curve) and the average amount of rain and snow that falls there (bars, in millimetres of water).