Primary & Middle School Earth and Space Sciences · Grades 1–9
11Weather and Climate
In the second week of January, two postcards arrive at the school. The first one, from Lena’s cousin, shows children building a sand castle on a sunny beach under palm trees. The second one, from Tom’s grandmother, shows children building a snowman in a snowy garden. “How can it be summer and winter in the same week?” asks Tom.
It is not the weather of one day that differs so much between the two places. It is the weather they have, year after year: their climate.


You already know
The weather is the state of the air at a given place and time: sunny, cloudy, rainy, snowy, windy (Chapter 1). A thermometer measures the temperature of the air, in degrees Celsius; a rain gauge measures the rain, in millimetres (Chapter 7). The equator runs round the middle of the globe, halfway between the North Pole and the South Pole (Chapter 6). The physics books showed that the Earth turns round the Sun in one year, and that its seasons come from the tilt of its axis: in summer, the Sun climbs higher in the sky and the days are longer.
11.1 Weather is today, climate is the usual
The weather changes from day to day, and even from hour to hour. Climate is something else.
Definition 11.1 (Climate)
The climate of a place is the weather it usually has, month by month, over many years: how warm or cold, how wet or dry each season is. Weather scientists work it out by averaging the measurements of 30 years.
“It is raining this morning” is a sentence about the weather. “It rains a lot in autumn here” is a sentence about the climate. A single cold day in summer does not change the climate; it is just unusual weather.
Weather scientists of the whole world use the same rule: they average 30 years of measurements. The averages used today are those of the years 1991 to 2020.
11.2 The climate chart
To show the climate of a place in one picture, we draw a chart.
Definition 11.2 (Climate chart)
A climate chart shows, for each month of the year, the average temperature of a place (a curve) and the average amount of rain and snow that falls there (bars, in millimetres of water).
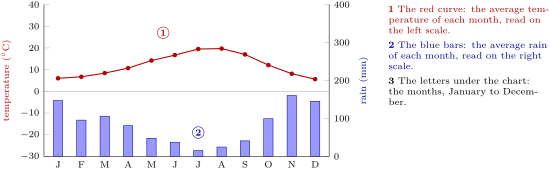
Method 11.3 (Reading a climate chart)
- Find the warmest and the coldest month on the red curve, and read their temperatures on the left scale. Is the curve flat (the same temperature all year) or does it rise and fall (warm and cold seasons)? Does it go below 0 C (frost)?
- Find the wettest and the driest month among the blue bars, and read them on the right scale. Are the bars tall or short? Is there a dry season?
- Put it together in one sentence: “hot and dry all year”, “mild and wet, with a dry summer”…
Example 11.4 (Seattle)
In Seattle, the warmest month is August (about 20 C) and the coldest is December (about 6 C): the curve rises and falls, but it never goes below freezing. The tallest bar is November’s (about 160 mm), the shortest July’s (about 15 mm). One sentence: mild winters, cool summers, wet in autumn and winter, rather dry in summer. In a whole year about 1 000 millimetres of rain fall: a metre of water.
11.3 Four climates
Here are the climate charts of four towns of the United States, far apart from each other: Phoenix, in the desert of Arizona; Hilo, on the island of Hawaii in the middle of the Pacific Ocean; Seattle, on the west coast; and Utqiaġvik, in the far north of Alaska, on the coast of the Arctic Ocean. All four charts use the same scales, so we can compare them at a glance.
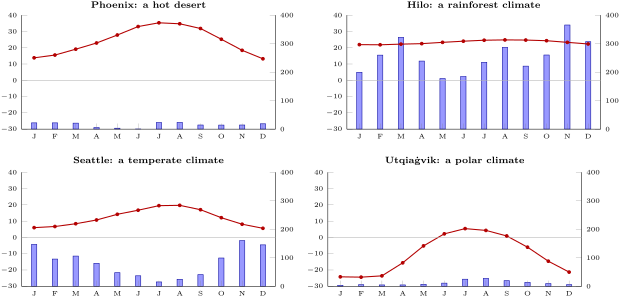
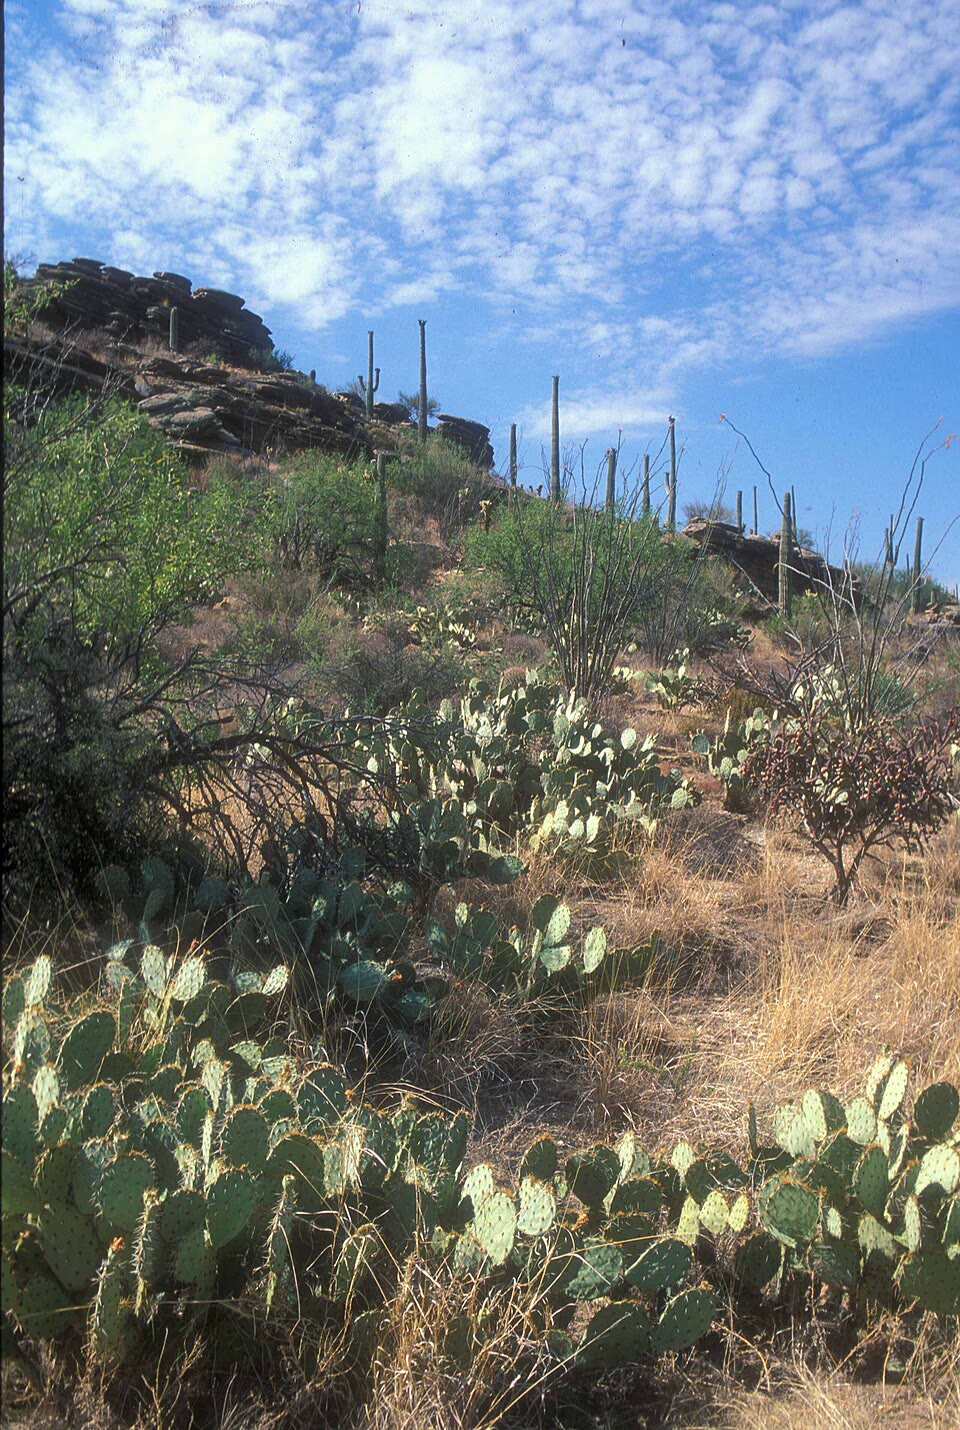
The desert. In Phoenix, the bars are so short that we can hardly see them: in a whole year, less than 200 millimetres of rain fall. The summers are very hot: in July the average temperature is 35 degrees.
Definition 11.5 (Desert)
A desert is a place where very little rain falls: less than 250 millimetres in a year. Few plants can live there, and the ground is often bare.
Deserts are not always hot. Look at Utqiaġvik: less than 150 millimetres fall there in a year, even less than in Phoenix: it is a cold desert. Deserts can be hot or cold.
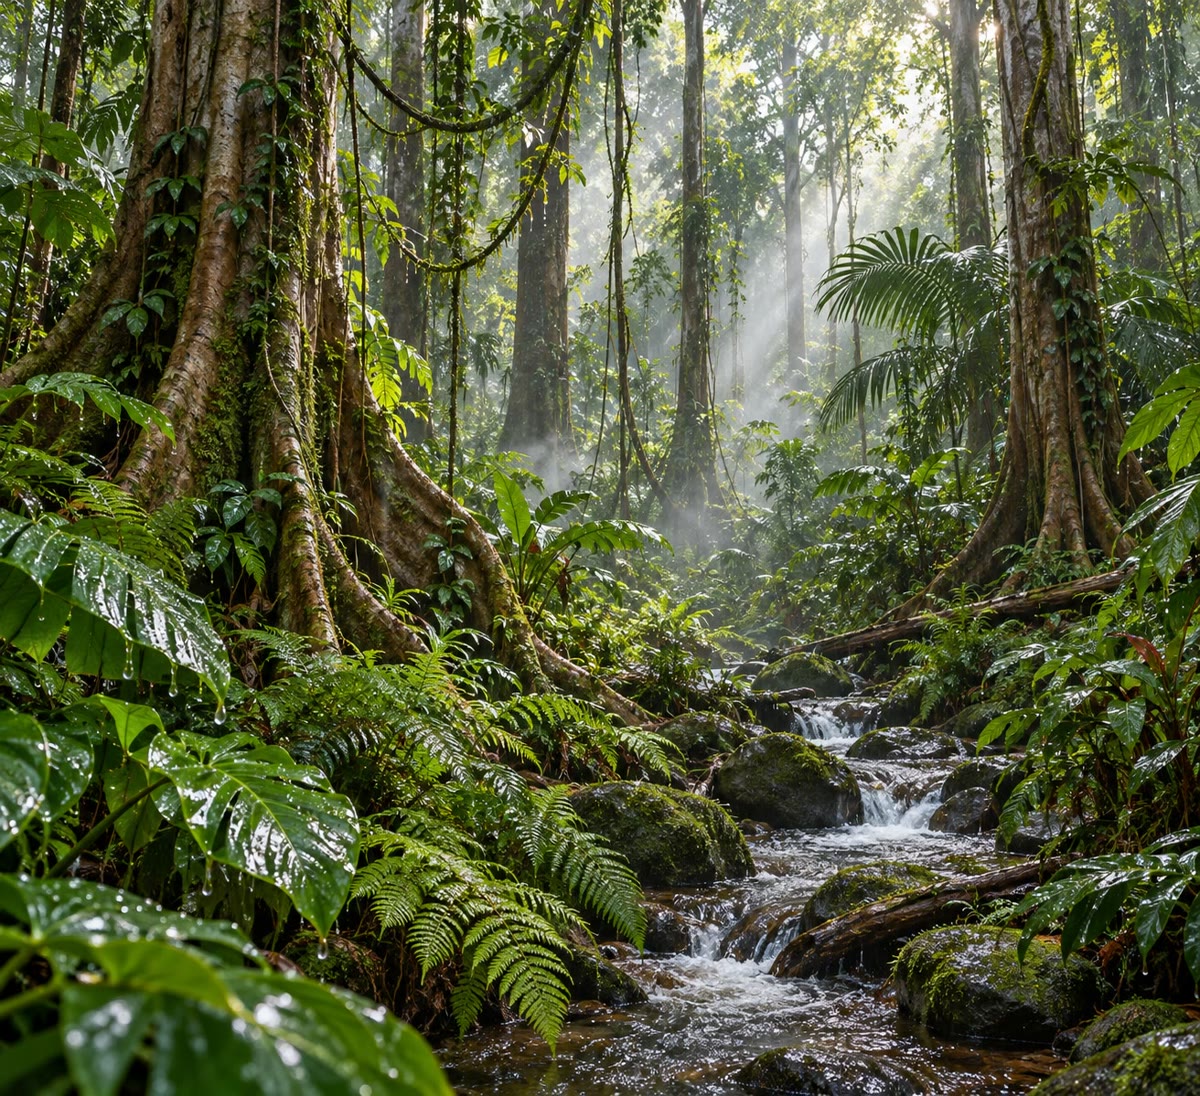
The rainforest. Hilo is the opposite of Phoenix. Its bars are the tallest of the four charts: more than 3 000 millimetres of rain fall in a year, and every month is wet. And its red curve is almost flat: between 22 and 25 degrees all year. There is no winter at all.
Definition 11.6 (Rainforest)
A rainforest is a thick forest of very tall trees that grows where it is warm and wet all year round, with heavy rain in every month. Most rainforests lie near the equator.
The temperate climate. Seattle is in between: its curve rises in summer and falls in winter, but never very far; it rains a fair amount, mostly in autumn and winter. This is a temperate climate: no great heat, no great cold.
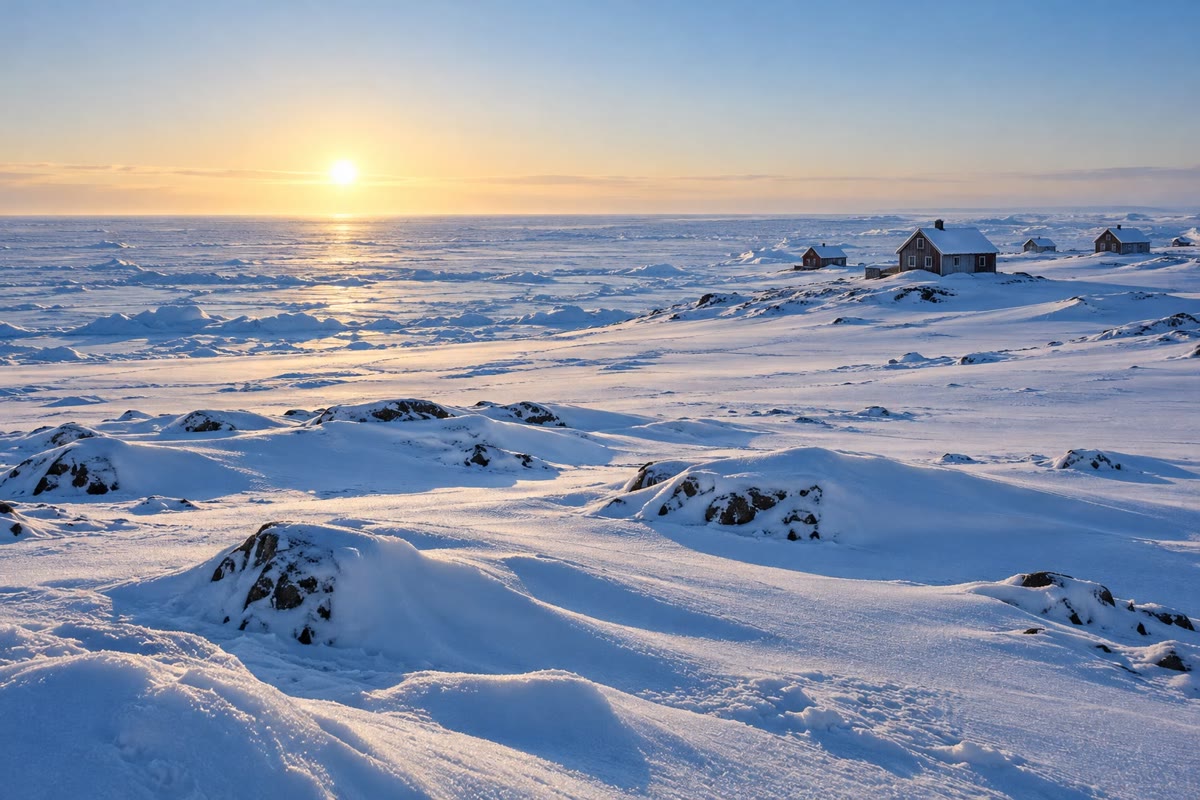
The polar climate. In Utqiaġvik, the red curve stays below 0 C for eight months of the year; in February the average is 24 degrees below zero. Even in July, the warmest month, it is only about 5 degrees.
11.4 Hot, temperate and cold zones
Why is it warm near the equator and cold near the poles? Because of the Sun. Near the equator, the midday Sun stands high in the sky all year round: its light falls almost straight down and warms the ground strongly. Near the poles, the Sun always stays low: its light arrives slanting, spread over a large area, and it warms little. In winter there, the Sun may not rise at all.
Two pairs of lines around the globe divide the Earth into climate zones.
Definition 11.7 (Tropics and polar circles)
The two tropics are the lines around the globe, one north and one south of the equator, that mark how far from the equator the midday Sun can be straight overhead: the Tropic of Cancer in the north, the Tropic of Capricorn in the south. The two polar circles are the lines around the globe, near the poles, beyond which, in the middle of winter, the Sun does not rise for at least one day, and in the middle of summer it does not set: the Arctic Circle in the north, the Antarctic Circle in the south.
The tilt of the Earth’s axis decides where these lines lie.
Definition 11.8 (Climate zones)
The Earth is divided into three kinds of climate zone: the hot zone, between the two tropics, around the equator; the two temperate zones, between a tropic and a polar circle, where summers and winters differ; and the two cold zones, beyond the polar circles, around the poles.
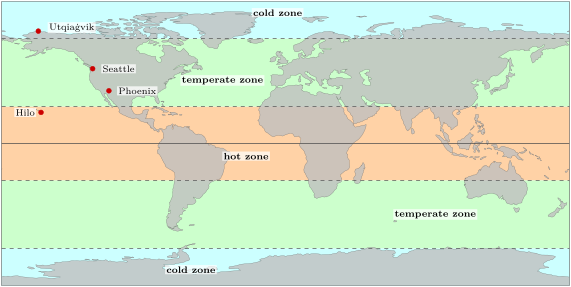
The zones give a first, rough picture. Inside each one, many other things change the climate: how far a place is from the sea, how high it is, where its winds come from. You will meet them in the later grades.
Remark 11.9 (Phoenix and the zones)
On the map of the zones, Phoenix lies a little north of the Tropic of Cancer, in the temperate zone, and yet it is a hot desert. The zones are a first, rough picture: many of the great hot deserts lie near the tropics, on the edge of the hot zone, and you will learn why in Chapter 24.
11.5 Exercises
Exercise 11.1 ★
- [(a)] It is snowing in Utqiaġvik this morning.
- [(b)] In Phoenix, summers are very hot and dry.
- [(c)] Yesterday afternoon a strong wind blew in Seattle.
- [(d)] In Hilo, it rains a lot in every month of the year.
Exercise 11.2 ★
What is the climate of a place? Over how many years do weather scientists average their measurements to describe it?
Exercise 11.3 ★
On the climate chart of Seattle, which is the coldest month? Which is the wettest month? Does the temperature ever go below 0 C?
Solution
Solution of Exercise 11.3.
The coldest month is December (about 6 C; January is almost as cold). The wettest month is November (about 160 mm). No: the curve never goes below 0 C.
Exercise 11.4 ★
On the climate chart of Utqiaġvik, which is the warmest month? Is any month warmer than 10 C?
Solution
Solution of Exercise 11.4.
July is the warmest month, at about 5 C. No month is warmer than 10 C.
Exercise 11.5 ★
In which climate zone is each of these places: the equator; the North Pole; a place halfway between the equator and the South Pole?
Solution
Solution of Exercise 11.5.
The equator: the hot zone. The North Pole: the cold zone (the northern one). Halfway between the equator and the South Pole: the southern temperate zone (it lies between the Tropic of Capricorn and the Antarctic Circle).
Exercise 11.6 ★
Use the map of the zones. In which climate zone is each of the four towns: Phoenix, Hilo, Seattle, Utqiaġvik?
Solution
Solution of Exercise 11.6.
Hilo: the hot zone. Phoenix and Seattle: the northern temperate zone. Utqiaġvik: the northern cold zone, beyond the Arctic Circle.
Exercise 11.7 ★★
Here is the average rain of each month in Seattle, in millimetres, rounded to whole numbers:
| J | F | M | A | M | J | J | A | S | O | N | D |
|---|---|---|---|---|---|---|---|---|---|---|---|
| 147 | 96 | 106 | 81 | 48 | 37 | 15 | 25 | 41 | 99 | 160 | 145 |
How much rain falls in Seattle in a whole year? How much falls in the three months of December, January and February?
Solution
Solution of Exercise 11.7.
Whole year: millimetres. December, January and February: millimetres, more than a third of the year’s rain in three months.
Exercise 11.8 ★★
In Phoenix, the average temperature is 14 C in January and 35 C in July. In Hilo, it is 22 C in January and 25 C in July. Compute the difference between July and January in each town. Where do the seasons change the temperature more?
Solution
Solution of Exercise 11.8.
Phoenix: degrees. Hilo: degrees. The seasons change the temperature much more in Phoenix; in Hilo it is almost the same all year.
Exercise 11.9 ★★
Here are the averages of an imaginary town.
| month | J | F | M | A | M | J | J | A | S | O | N | D |
|---|---|---|---|---|---|---|---|---|---|---|---|---|
| temperature (C) | 27 | 27 | 28 | 28 | 28 | 27 | 27 | 27 | 27 | 27 | 27 | 27 |
| rain (mm) | 250 | 230 | 280 | 290 | 260 | 180 | 170 | 160 | 190 | 230 | 250 | 260 |
Is it a desert, a rainforest, a temperate or a polar climate? Give two reasons. In which zone is the town most likely to be?
Solution
Solution of Exercise 11.9.
A rainforest climate: it is hot all year (27 or 28 C, with no winter), and a lot of rain falls in every month (at least 160 mm, and more than 2 000 mm in the year). The town is most likely in the hot zone, near the equator.
Exercise 11.10 ★★
Go back to the two postcards at the start of the chapter, sent in the same week of January. Give two different explanations of how children can play on a sunny beach in one place while others build a snowman in another.
Solution
Solution of Exercise 11.10.
First explanation: the beach is in the hot zone, where it is warm all year, and the snowy garden in a temperate or cold zone, where January is in winter. Second explanation: the beach is in the southern half of the Earth, where January is in summer, and the snowy garden in the northern half, where January is in winter: the seasons are reversed between the two halves of the globe.
Exercise 11.11 ★★★
Noor says: “Phoenix and Seattle are both in the temperate zone, so they must have the same climate.” Use the climate charts to show that she is wrong: compare their temperatures and their rain. Then say what the climate zones tell us, and what they do not.
Solution
Solution of Exercise 11.11.
Temperatures: Phoenix is much hotter, about 35 C in July against about 20 C in August for Seattle, and its January (about 14 C) is already as warm as Seattle’s May. Rain: less than 200 mm a year in Phoenix, a desert, against about 1 000 mm in Seattle. So they do not have the same climate. The zones tell us, roughly, how much the Sun warms a place, from the equator to the poles; they do not tell us how much rain falls, nor the effect of the sea, of the mountains or of the winds.