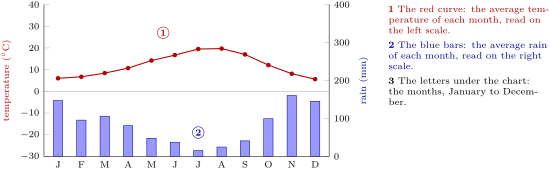
A climate chart shows, for each month of the year, the average temperature of a place (a curve) and the average amount of rain and snow that falls there (bars, in millimetres of water).
 Coach
সাইন ইন
পড়া শুরু করো
বইগুলো এখনো বাংলা ভাষায় পাওয়া যায় না — ইংরেজি সংস্করণ দেখানো হচ্ছে।
Earth and Space Sciences · পরিভাষা
A climate chart shows, for each month of the year, the average temperature of a place (a curve) and the average amount of rain and snow that falls there (bars, in millimetres of water).