All books

Professional

Apps About Coach Log in Start reading

Earth and Space Sciences · Glossary

What is Grade–tonnage curve?

Also known as: grade--tonnage curve

Definition 29.12 University Earth and Space Sciences — Year 2 · Chapter 29 — Ore Deposits

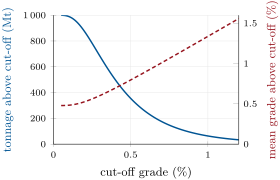
The grade–tonnage curve of a deposit gives, as functions of the cut-off grade cc, the tonnage T(c)T(c) of the blocks with a grade above cc and their mean grade gˉ(c)\bar g(c).

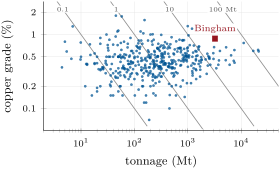
Left: tonnage and copper grade of the 422 porphyry copper deposits, with lines of equal contained copper (0.1 to 100\, Mt); the red square is Bingham Canyon. Data: Singer, Berger and Moring (2008), USGS. Right: the grade–tonnage curve of an illustrative deposit of 1000\, Mt, median grade 0.40\,\%, s = 0.60: tonnage above the cut-off (blue) and its mean grade (red, dashed), from .
Left: tonnage and copper grade of the 422 porphyry copper deposits, with lines of equal contained copper (0.1 to 100 Mt100\,\mathrm{Mt}); the red square is Bingham Canyon. Data: Singer, Berger and Moring (2008), USGS. Right: the grade–tonnage curve of an illustrative deposit of 1000 Mt1000\,\mathrm{Mt}, median grade 0.40 %0.40\,\%, s=0.60s = 0.60: tonnage above the cut-off (blue) and its mean grade (red, dashed), from (29.4).
Read in context →