
সব বই

পেশাদার

1 Markets I: The Ecosystem and Exchange-Traded Marketsবাজার অনলাইন 2 Markets II: Rates, FX and Creditবাজার অনলাইন 3 Markets III: Commodities, Energy and Cryptoবাজার অনলাইন 4 Quantitative Methodsপদ্ধতি অনলাইন 5 Derivatives and Volatilityডেরিভেটিভস অনলাইন 6 Rates, Credit, XVA and Riskসুদহার, ঋণ ও ঝুঁকি অনলাইন 7 Research Craft: Predictors, Backtests, Measurement, Portfoliosগবেষণা অনলাইন 8 Strategies I: Equities and Futuresকৌশল অনলাইন 9 Strategies II: Volatility, Relative Value, Macro and the Bank Desksকৌশল অনলাইন 10 Microstructure and Executionএক্সিকিউশন অনলাইন 11 Market Making and High-Frequency Tradingমার্কেট মেকিং অনলাইন 12 Machine Learning for Marketsমেশিন লার্নিং অনলাইন 13 Low-Latency Softwareপ্রযুক্তি অনলাইন 14 Networks, Hardware and Trading Infrastructureপ্রযুক্তি অনলাইন 15 Research, Data and Risk Platformsপ্রযুক্তি অনলাইন 16 The Desk and the Firmপ্রতিষ্ঠান অনলাইন 17 The Industry: Firms, Roles and Careersক্যারিয়ার অনলাইন 18 Interviews I: Maths, Probability and Speedক্যারিয়ার অনলাইন 19 Interviews II: Markets, Trading Games and the Final Roundক্যারিয়ার অনলাইন 20 Interviews III: Codeক্যারিয়ার অনলাইন
অ্যাপ পরিচিতি Coach সাইন ইন পড়া শুরু করো

বইগুলো এখনো বাংলা ভাষায় পাওয়া যায় না — ইংরেজি সংস্করণ দেখানো হচ্ছে।

Earth and Space Sciences · পরিভাষা

Kerogen type, van Krevelen diagram কী?

অন্য নাম: kerogen type · van Krevelen diagram

Definition 30.1 University Earth and Space Sciences — Year 2 · অধ্যায় 30 — Energy Geology

Kerogens fall into three kerogen types by their elemental composition: type I, sapropelic, the richest in hydrogen, which generates mainly oil; type III, humic or coaly, poor in hydrogen, which generates mainly methane; and type II, intermediate, a source of both oil and gas. The van Krevelen diagram plots the atomic ratio H/C of a kerogen against its atomic ratio O/C; the types occupy different regions of it, and maturation moves a kerogen toward low H/C and low O/C.
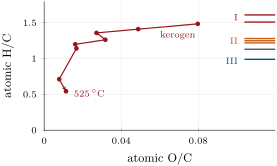
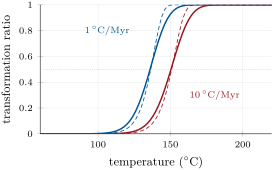
Left: a van Krevelen diagram. The red path is the Green River type I kerogen and its residues after laboratory heating at 10\, K per minute to 400–525\, C; the ticks on the right mark the H/C of seven immature kerogens of type I (red), II (orange), II/III (grey) and III (blue), whose O/C was not reported. Data: Fletcher and Pugmire (2014); Advanced Chemistry Basins Project (2004). Right: transformation ratio of the Green River kerogen heated at constant rates from 10\, C, with its distribution of activation energies (solid) and with its mean energy alone, by  (dashed).
Left: a van Krevelen diagram. The red path is the Green River type I kerogen and its residues after laboratory heating at 10 K10\,\mathrm{K} per minute to 400–525 ∘C525\,{}^{\circ}\mathrm{C}; the ticks on the right mark the H/C of seven immature kerogens of type I (red), II (orange), II/III (grey) and III (blue), whose O/C was not reported. Data: Fletcher and Pugmire (2014); Advanced Chemistry Basins Project (2004). Right: transformation ratio of the Green River kerogen heated at constant rates from 10 ∘C10\,{}^{\circ}\mathrm{C}, with its distribution of activation energies (solid) and with its mean energy alone, by (30.1) (dashed).
প্রসঙ্গসহ পড়ো →