University Earth and Space Sciences — Year 2 · Bachelor Year 2
30Energy Geology
Oil is the remains of microscopic organisms, buried with mud and cooked for millions of years at around ; geothermal energy is the same warmth of the Earth, taken directly. Both are ruled by temperature and time: the first by the rate at which a chemical reaction runs as buried rocks slowly warm, the second by how much heat a volume of rock stores and how fast water can carry it to a well. This chapter quantifies the petroleum system, turns to the resources that lack one of its elements, to geothermal heat and to uranium, and ends with the reverse operation: putting carbon dioxide back underground.
You already know
From the school volumes: source rock, kerogen, maturation, oil window, migration, reservoir rock, seal, trap, overburden, petroleum system; coal and coal rank; geothermal energy. From the Year 1 volume: heat flow and the geotherm; porosity and permeability; pore-fluid pressure, effective stress and the Coulomb criterion; borehole log; sedimentary basin and subsidence. From the chemistry books: the Arrhenius law, activation energy, first-order reaction. From the physics books: radioactive decay, decay constant, half-life; the critical point of a fluid. From Chapter 16: subsidence curve. From Chapter 29: ore-deposit type, tonnage.
30.1 The petroleum system quantified
A petroleum system needs a source rock rich in kerogen, a reservoir, a seal, a trap and enough overburden to heat the source rock, and its events must come in the right order: the trap must exist when the oil migrates. Quantifying it means answering three questions: what kind of kerogen the source rock holds, how far it has been converted, and how much of the product sits in the trap.
Definition 30.1 (Kerogen type, van Krevelen diagram)
Kerogens fall into three kerogen types by their elemental composition: type I, sapropelic, the richest in hydrogen, which generates mainly oil; type III, humic or coaly, poor in hydrogen, which generates mainly methane; and type II, intermediate, a source of both oil and gas. The van Krevelen diagram plots the atomic ratio H/C of a kerogen against its atomic ratio O/C; the types occupy different regions of it, and maturation moves a kerogen toward low H/C and low O/C.
Seven immature kerogens of known type, analysed in one laboratory study, have atomic H/C of 1.51 and 1.61 (type I, among them the Green River oil shale of Utah, laid down in lakes and rich in the remains of algae), 1.22 to 1.28 (type II, among them the Kimmeridge Clay of the North Sea), 1.13 (a mixed type II/III) and 0.99 (type III, the Cameo coal of Colorado). The Green River kerogen, carbon by mass, averages CHNOS: H/C 1.50 and O/C 0.08. Heated in the laboratory at per minute, it leaves a residue whose H/C falls to 1.20 at and 0.54 at , while its O/C falls from 0.08 to about 0.01: the path drawn on the left of the figure below.
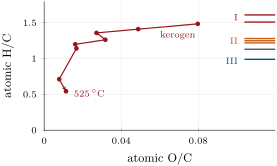
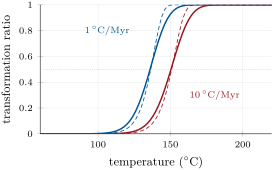
The conversion of kerogen to petroleum is a set of first-order reactions, each obeying the Arrhenius law. In a subsiding basin the temperature of a source rock rises slowly and almost steadily, which makes the following result the core of maturation models.
Proposition 30.2 (First-order reaction at a constant heating rate)
Let a first-order reaction of rate constant run in a material heated at the constant rate from a temperature at which is negligible. The fraction left unconverted at the temperature is
the approximation holding when ; the transformation ratio is .
Proof. First order means . With , , and integrating from at gives the first form. For the integral, , so the integral equals up to a relative correction of order , the lower limit contributing nothing as . ∎
Two consequences follow. Conversion happens over a narrow range of temperature, because changes so fast (exercise 30.11). And slower heating converts at a lower temperature: setting , a heating rate ten times faster raises the temperature of half conversion by about . The kinetics of the Green River kerogen, fitted to laboratory pyrolysis, are and (); with this single energy, half conversion occurs at for and at for , a shift of against predicted. Heated at per minute, the same kerogen converts near (exercise 30.6): time stands in for temperature, which is why kinetics are measured by pyrolysis at about 250 to , and why extrapolating them across twelve orders of magnitude in heating rate leaves the predicted depth of the oil window uncertain.
A real kerogen holds bonds of many strengths, so its kinetics are a distribution of activation energies, each fraction obeying the proposition; for the Green River kerogen the distribution is normal, with a standard deviation . The distribution spreads the conversion, as the right of the figure shows: at the kerogen heated at is converted, the one heated ten times faster .
Definition 30.3 (Vitrinite reflectance, time–temperature index)
Vitrinite reflectance, , is the percentage of incident light reflected by polished grains of vitrinite, an organic component of coal and of kerogen, measured under a microscope; it rises irreversibly with heating and records the highest thermal maturity a rock has reached. The time–temperature index (TTI) of Lopatin is the sum over the intervals of that a rock has passed through, being the time in millions of years spent in the interval numbered , with for 100 to , for 110 to , for 90 to , and so on.
On the reflectance scale, oil generation from type I and II kerogens begins near ; above 1.20 to oil is unstable and breaks down to methane; type III begins to yield methane near , and gas generation goes on up to about . Models compute like a kerogen: the Easy%Ro model treats vitrinite as twenty parallel first-order reactions with and energies from 34 to (142 to ), and maps their converted fraction , at most 0.85, to , which runs from 0.20 to .
Reflectance is computed the same way along every horizon of a basin. In the invented basin of the figure below, sediment accumulated at per million years from 100 to , then at per million years, under a surface at and a steady gradient of . Its oldest horizon reached at , at and , and at , at and ; it now lies at and , at . Because the geotherm is steady, the reflectance fronts run almost along isotherms, the onset of oil generation near , within the 60 to of the school volumes.
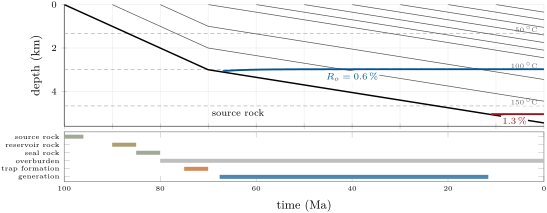
The TTI is older and cruder. It assumes that maturation doubles its rate for every , as an Arrhenius law with does near (exercise 30.5); on its scale Waples placed the onset of oil generation at a TTI of 15, its peak at 75 and its end at 160.
Method 30.4 (Computing a time–temperature index)
The data are the burial history of the source rock and the geotherm, assumed steady.
- Temperature path. Convert depth to temperature at each time: surface temperature plus gradient times depth.
- Times in the intervals. Find the time spent in each interval of ; where the heating rate is constant, .
- Sum. Add the products in order of time; the onset, peak and end of oil generation are reached when the running sum passes 15, 75 and 160.
Basin models express conversion as a transformation ratio: the fraction of the original hydrocarbon potential of a source rock already converted. In one model of a Californian basin, expulsion from the source rock was taken to begin at a ratio of , to peak at and to end at . The expelled oil, lighter than water, migrates upward into permeable reservoir rocks, and is held where a seal closes a trap.
Proposition 30.5 (Oil in place)
Let a trap have area and a reservoir of net thickness , porosity and water saturation , and let be the formation volume factor of its oil, the ratio of the volume a quantity of oil occupies in the reservoir to its volume at the surface. The stock tank oil initially in place, the oil volume measured at the surface, is
Proof. The bulk volume of the reservoir is and its pore volume ; a fraction of the pores holds oil, so the oil occupies in the reservoir, and times this at the surface. ∎
Definition 30.6 (Recovery factor)
The recovery factor of a reservoir is the fraction of the oil (or gas) initially in place that is produced over its life.
Primary production and secondary recovery by water injection together typically recover 30 to of the oil in place; injecting carbon dioxide recovers 10 to more. A trap of with of net reservoir, porosity 0.20, oil saturation 0.70 and holds of stock-tank oil, of which 1.05 to would be produced.
30.2 Unconventional resources
Definition 30.7 (Unconventional reservoir)
An unconventional reservoir is a rock of such low permeability that the oil or gas held in its microscopic pores cannot flow to a well at an economic rate without artificial stimulation; it is produced through wells drilled horizontally along it and fractured hydraulically. Shale oil and shale gas are held in the source rock itself, tight gas in low-permeability sandstones and carbonates.
An unconventional play is thus a source rock, or a rock beside it, that kept part of what it generated. Which product it holds follows from its maturity: a shale in the oil window holds oil, one past gas. Large-scale production of shale gas began around 2000 in the Barnett Shale of Texas, and most of the growth of United States gas production since 2005 has come from horizontal drilling and hydraulic fracturing in shale, sandstone, carbonate and other tight formations; gas is also produced from coal beds.
30.3 Geothermal energy
Definition 30.8 (Geothermal system, heat in place, enthalpy classes, EGS)
A geothermal system is a volume of the crust where heat, permeability and water come together so that hot water or steam can be produced from wells. The heat in place of a reservoir is the heat it would give up in cooling from its temperature to a reference temperature. A high-enthalpy resource is a geothermal system above about ; a low-enthalpy resource one below about ; between the two the resource is called moderate. All three suit direct use of the heat, but generally only the moderate and high classes can generate electricity. An enhanced geothermal system (EGS) is a body of hot rock of low natural permeability in which permeability is created by engineering, so that water can be circulated through it and its heat recovered.
Proposition 30.9 (Heat in place and recoverable power)
A reservoir of volume , mean temperature and volumetric heat capacity (rock and pore fluid together) holds, above the reference temperature , the heat
If a fraction of it reaches the wellheads over a production time , the mean thermal power produced is .
Proof. A volume at temperature releases in cooling to ; summing over the reservoir with uniform gives with the mean temperature. The power is the recovered heat divided by the time. ∎
Resource assessments use this volume method with a reference of . The recovery factor is the uncertain part: early assessments took 0.25, between 0 and 0.5; production from fractured reservoirs points to about 0.1, between 0.05 and 0.2. With (rock matrices hold 2 to ), a reservoir of at holds ; with over 30 years it yields a mean thermal power of . Conventional fields generate 10 to of electricity per square kilometre of field.
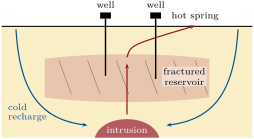
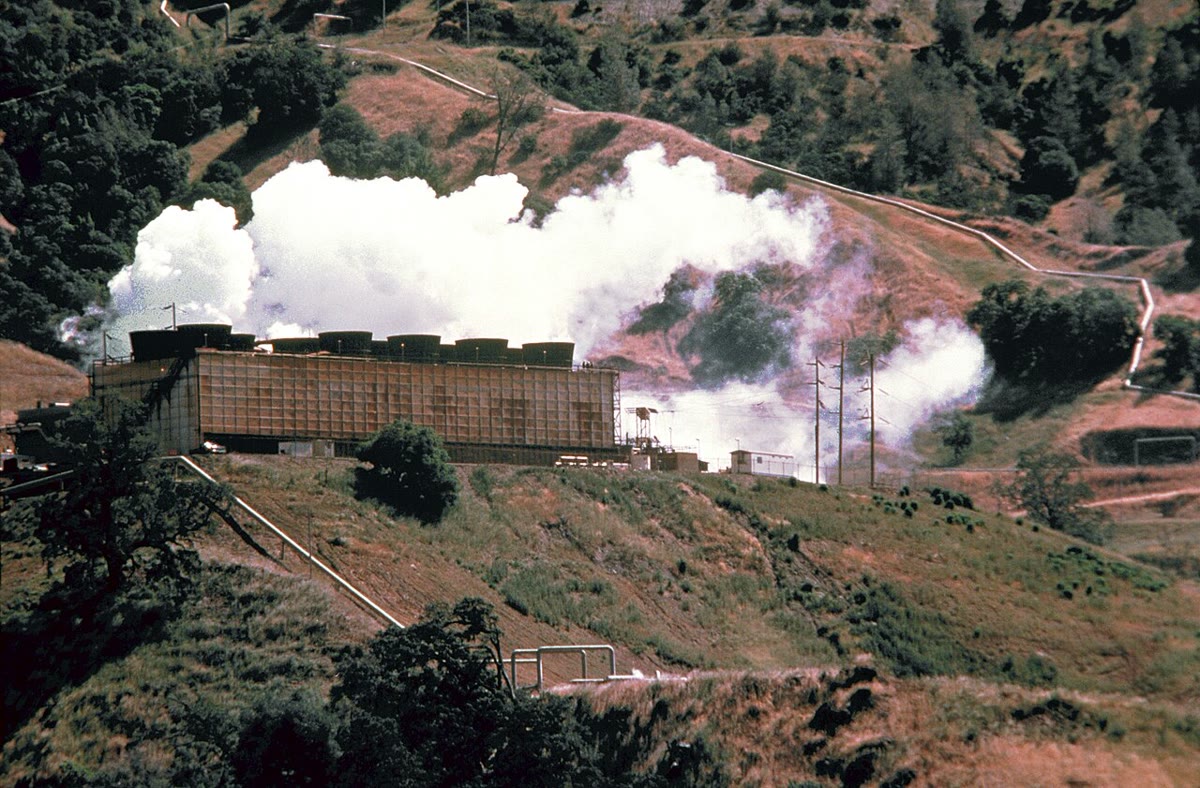
Natural geothermal systems need permeability as much as heat. Most of the major ones lie near the edges of the tectonic plates, among volcanoes, fumaroles, hot springs and geysers, and their permeability is typically that of fractures opened by active faulting: groundwater heated at depth rises through them, and wells tap the fractured reservoir, as in the section below. An EGS needs no natural reservoir: its wells, drilled to about , reach hot rock whose permeability is engineered, and a 2008 assessment of the United States put its provisional potential at of electricity, against from identified conventional systems.
Definition 30.10 (Induced seismicity)
Induced seismicity is earthquake activity caused by human operations that change the stress or the pore-fluid pressure in the crust, most often the injection of fluid into the ground.
The mechanism is the Coulomb criterion with pore-fluid pressure: a fault slips when the shear stress reaches , so raising brings a fault that is already stressed toward failure without any change of the tectonic load. In the 1960s, waste fluid injected into fractured Precambrian basement beneath the Rocky Mountain Arsenal near Denver, at depths of 3.7 to , triggered earthquakes; they were confined to the part of the reservoir where the pressure had risen by more than (). The steep rise in the earthquakes of Oklahoma has been attributed to the disposal of wastewater: four high-volume wells could account for a fifth of the seismicity of the central United States, triggering earthquakes more than away. Stimulating an EGS reservoir raises the pore pressure in the same way, by design.
30.4 Uranium
Two ore-deposit types illustrate how uranium is concentrated: one at an ancient unconformity, the other in sandstone.
Definition 30.11 (Unconformity-related and roll-front uranium deposits)
An unconformity-related uranium deposit is a body of pitchblende and uraninite filling fractures and breccias in metamorphosed carbonaceous pelites and in the quartz arenites above them, below, above or across an unconformity between Early and Middle Proterozoic rocks in an intracratonic basin. A roll-front uranium deposit is a crescent-shaped body of uranium minerals that cuts across the bedding of a feldspathic or tuffaceous sandstone at the boundary between oxidized and reduced ground, where uranium was deposited in a locally reduced environment, among pyrite.
The unconformity deposits are hosted by rocks of 1800 to , the metamorphosed pelites below the unconformity and the unmetamorphosed sandstones above it; their host rocks are chloritized, and the graphitic schists that accompany many of them are strong electrical conductors, a target for electromagnetic surveys. Key Lake, Cluff Lake and Rabbit Lake in Saskatchewan and Jabiluka and Ranger in northern Australia are examples. The roll fronts are younger, mostly Tertiary: in sandstones fed by felsic volcanic ash or granite, oxidized iron minerals lie up-dip of the front and reduced ones down-dip, as in the basins of Wyoming and the Texas Gulf Coast.
Proposition 30.12 (Uranium-235 in the past)
Let be today’s atomic ratio U/U and , the decay constants of the two isotopes. A time ago the ratio was
and U made up a fraction of the atoms of uranium, neglecting the trace of U.
Proof. Each isotope decays exponentially: and . Dividing, . ∎
With , and today’s abundances and , ; ago and natural uranium held of U, five times today’s share.
History — A reactor two billion years old
In 1972, French scientists measuring uranium ore found small but significant deficits of U, which they traced to the Oklo mine in Gabon. There, pods of rock held up to uranium with as little as half the normal share of U, and neodymium depleted in its primordial isotope Nd but enriched in the isotopes 143 to 150 that fission produces: chain reactions had run in the ore about two billion years ago, at about and 400 to . Sixteen such natural reactors are known at Oklo and nearby Bangombé, the only two deposits in the world where they have been found; organic matter had helped concentrate the uranium, and the uranium oxide has held most of the actinides and of the non-volatile fission products in place ever since.
30.5 Geological storage of carbon dioxide
Definition 30.13 (Geological storage, trapping mechanisms, storage efficiency factor)
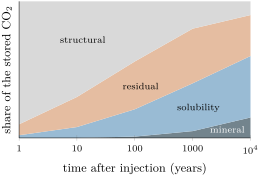
Geological storage is the injection of carbon dioxide into porous rock formations deep underground, depleted oil and gas reservoirs, deep saline formations or coal beds, for retention over long times. The trapping mechanisms that retain it are structural (and stratigraphic) trapping below a seal; residual trapping, as an immobile phase held in the pores by capillary forces; solubility trapping, by dissolution in the formation water; mineral trapping, by reaction with minerals into carbonates; and, in coal and shale, adsorption onto organic matter. The storage efficiency factor of a formation is the fraction of its pore volume that the injected can be expected to fill.
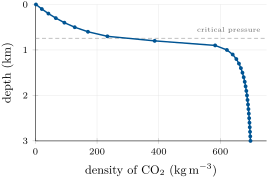
Carbon dioxide is a gas at the surface, but its critical point lies at and . Along a geotherm of from under hydrostatic pressure, the temperature passes the critical value at and the pressure at ; the density of pure jumps from at to at , then levels off near 670 to below . A tonne occupies at the surface and at , 330 times less; this is why storage assessments consider only formations deeper than .
Proposition 30.14 (Storage capacity of a formation)
A formation of area , thickness and porosity , in which has the density and the storage efficiency factor is , can store the mass
For a depleted oil field that has produced a stock-tank volume , replacing the produced oil volume for volume gives .
Proof. The pore volume is , of which the fills a fraction , at density . In the oil field, the produced oil occupied in the reservoir, the volume the takes over. ∎
For deep saline formations, simulations give between 1 and of the pore volume over a 15 to 85 per cent confidence range, with a median near : most of the pore space is never reached, or keeps its water. A formation of , thick and of porosity 0.20 at () stores at .
Once injected, the rises under the seal and spreads. Behind the migrating plume, capillary forces hold residual saturations that may reach 15 to of the pore space; dissolution takes up 20 to of per cubic metre of formation water, and in slowly flowing formations up to of the injected dissolves within tens of years. Solubility trapping dominates over tens to hundreds of years, ionic forms over hundreds to thousands, mineral trapping over thousands to millions: reactions with carbonate minerals take days, with silicates hundreds to thousands of years. The storage becomes more secure as it ages, and at well-chosen and well-managed sites the retention of or more of the over 1000 years was judged likely.
Figures as of 2005
At Sleipner, in the North Sea about off Norway, the separated from the natural gas of the field, about of it, has been injected since October 1996 into the Utsira formation, an unconsolidated saline sandstone 800 to below the sea floor, at about a year. By early 2005 more than had been stored, of the planned over the project’s life. Repeated seismic surveys image the plume, whose footprint was then about , and show that the caprock above it seals it.
In the field — Reading a well while it is drilled
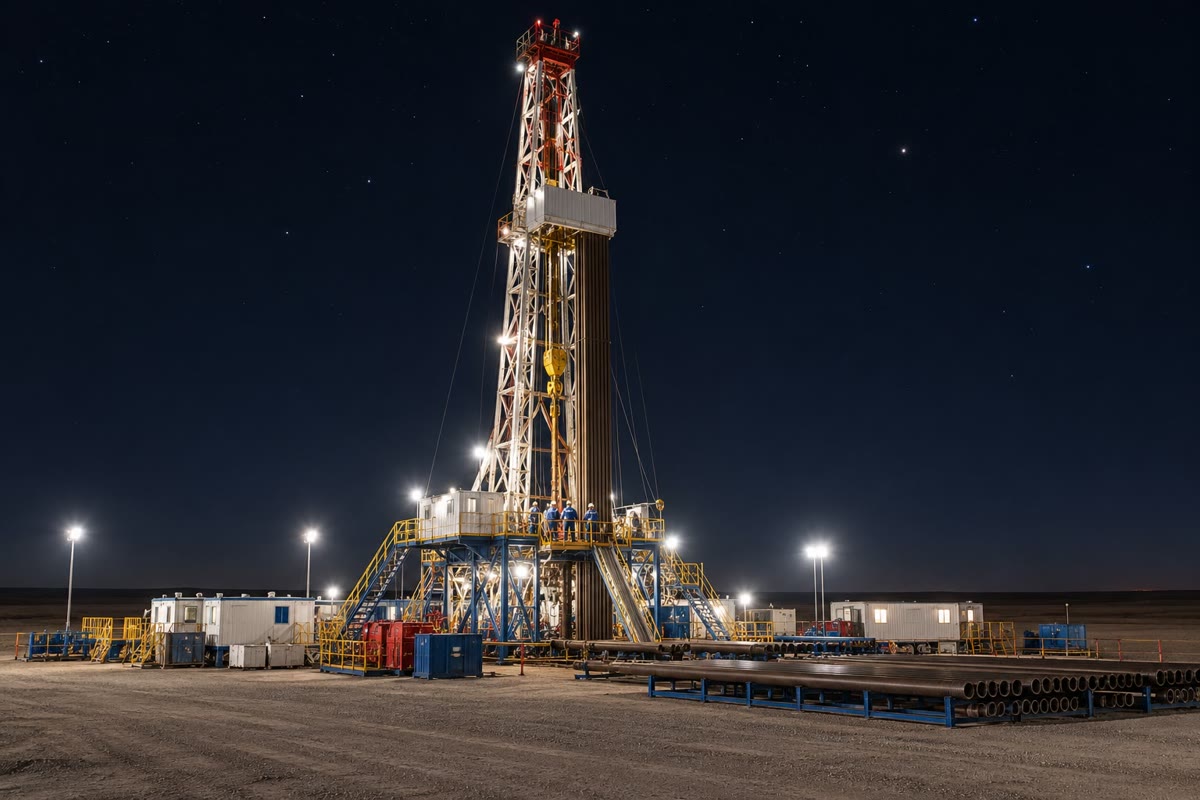
When a section of a well is finished, geophysicists lower tools on a cable and record against depth the properties of the rocks around the hole. One records their natural radioactivity, low in sandstone and higher in shale; another their bulk density, from which the porosity follows as (grain density bulk density)/(grain density fluid density), with for quartz grains and about for the water. Read together, these borehole logs give the net reservoir thickness and the porosity that enter the volumetric formulas of this chapter.
Exercises
Data for the exercises, unless stated otherwise: ; one million years is ; Green River kerogen , ; atomic masses C 12.011, H 1.008, O 15.999; density of along the profile of the figure: at the surface, 583 at , 621 at , 686 at . Round to three significant figures.
Exercise 30.1 ★
(a) Four immature kerogens have atomic H/C of 1.58, 0.95, 1.24 and 1.12. Assign each a type and say which would yield mainly gas. (b) Check the ratios H/C and O/C of the formula CHNOS. (c) Find them from the mass composition C , H , O .
Solution
Solution of Exercise 30.1.
(a) 1.58: type I; 0.95: type III; 1.24: type II; 1.12: mixed type II/III. The type III kerogen, at 0.95, yields mainly gas. (b) H/C , O/C . (c) Per : C, H, O; H/C and O/C , in agreement with the formula.
Exercise 30.2 ★
(a) Five samples of a type II source rock have = 0.45, 0.68, 1.1, 1.6 and . Describe the state of each with respect to oil and gas. (b) Is a type III kerogen at generating methane? (c) Which converted fraction of Easy%Ro corresponds to and ?
Solution
Solution of Exercise 30.2.
(a) 0.45: immature, below the onset at ; 0.68: generating oil; 1.1: still in the oil window, near its end; 1.6: past 1.20–, so oil breaks down to methane and the rock yields gas; 2.5: gas only, generation continuing up to about . (b) No: methane generation from type III begins near . (c) : and .
Exercise 30.3 ★
A trap covers ; its reservoir has of net thickness, porosity 0.18 and water saturation 0.30, and . (a) Find the oil volume in the reservoir and the STOIIP. (b) Find the volume produced for recovery factors of 0.30 and 0.40.
Solution
Solution of Exercise 30.3.
(a) In the reservoir, ; . (b) and .
Exercise 30.4 ★
A sandstone aquifer thick under is at . (a) Find its heat in place above , with . (b) To which enthalpy class does it belong? (c) Find the mean thermal power over 30 years for .
Solution
Solution of Exercise 30.4.
(a) and . (b) Below : a low-enthalpy resource, for direct use of the heat. (c) of heat.
Exercise 30.5 ★★
(a) Find the activation energy for which an Arrhenius rate doubles between 100 and . (b) By what factor does the rate of the Green River reaction grow over the same interval? (c) Which of the two rules gives more weight to the time a rock spent at low temperature, and what does this imply for a TTI computed for a type I source rock?
Solution
Solution of Exercise 30.5.
(a) with gives . (b) . (c) The doubling rule, whose effective energy is lower, gives relatively more weight to the long times spent at low temperature; for a type I kerogen with a high activation energy, the TTI announces generation too early.
Exercise 30.6 ★★
(a) Show from (30.1) that the temperature of half conversion obeys , and solve it by iteration for the Green River kerogen heated at and at per minute. (b) Compare the difference with the estimate taken at the lower temperature, and explain the discrepancy.
Solution
Solution of Exercise 30.6.
(a) in the approximation gives ; taking logarithms, , and the stated form follows. Starting from any guess near and iterating with in kelvins per second: at (), , ; at per minute (, times faster), , . (b) The difference is ; the estimate is far too small, because itself grows with (to at ): the linear shift holds only for small changes of rate.
Exercise 30.7 ★★
Using (30.4) and the data of the text: (a) find the share of U in natural uranium and ago; (b) when was it ? (c) Oklo ore holds as little as half today’s normal share of U. Ignoring the U consumed, what fraction of the U present at the time of the reactions was fissioned, and why does the later decay not change the answer?
Solution
Solution of Exercise 30.7.
and . (a) At , , share ; at , , share . (b) and . (c) Both the depleted ore and normal uranium have decayed since by the same factors, so the ratio of their U shares is the same today as just after the reactions: the ore then held half the normal share, so about half of its U had been fissioned.
Exercise 30.8 ★★
(a) Find the volume of of at the surface, at and at . (b) At Sleipner more than had been injected by 2005, at about , into a plume of footprint . Taking a porosity of 0.35 and a saturation of 0.30 in the plume, find the volume of rock it occupies and its mean thickness.
Solution
Solution of Exercise 30.8.
(a) ; ; . (b) of , filling of the rock volume: of rock, a mean thickness of .
Exercise 30.9 ★★
A high-enthalpy reservoir measures at , with . (a) Find its heat in place above . (b) Find the mean thermal power over 30 years for and . (c) Its field covers ; at 10 to of electricity per square kilometre, what fraction of the thermal power at becomes electricity?
Solution
Solution of Exercise 30.9.
(a) and . (b) Over : gives and gives of heat. (c) to of electricity, to of the thermal power: most of the heat is rejected, as in any power plant working with a modest temperature difference.
Exercise 30.10 ★★★
A fault at about carries a normal stress of and a shear stress of ; its friction coefficient is 0.6 and the pore pressure is hydrostatic, . (a) Is the fault stable? Find the pore-pressure rise that brings it to failure, in megapascals and in bars, and compare with the Denver threshold. (b) The same if the shear stress is . (c) Explain why earthquakes can be triggered kilometres away from an injection well, and years after injection began.
Solution
Solution of Exercise 30.10.
(a) The strength is : stable. Failure needs , , of the same order as the that bounded the Denver earthquakes. (b) : a fault already close to failure needs only a small rise. (c) Injected fluid raises the pressure in a zone that spreads by diffusion through permeable rock and fault zones, kilometres away over years; wherever it meets a fault already near failure, a modest rise is enough.
Exercise 30.11 ★★★
(a) From the approximation in (30.1), show that at a constant heating rate the transformation ratio rises from to over a temperature interval . (b) Evaluate it for the Green River kerogen at . (c) Compare with the solid curve of the figure and explain the difference.
Solution
Solution of Exercise 30.11.
(a) Write with . A transformation ratio of means , ; means . As , , which gives the formula, with . (b) With , and ; the exact single-energy curve gives , from 125.3 to . (c) The solid curve rises from near to near , over about : the spread of activation energies widens the conversion interval.
Exercise 30.12 ★★★
Sleipner is to store of . (a) Find the volume of formation water needed to dissolve it all, at 20 and at . (b) Find its volume as a free phase at . (c) With , find the pore volume of formation required, and the area of a formation thick of porosity 0.30.
Solution
Solution of Exercise 30.12.
(a) () and . (b) . (c) of pores, which with of pore space per square metre requires , about .
Problem 30.1
Weekend problem — One basin, two uses
In an invented basin, a type I source rock was deposited at at the surface. Sediment then accumulated at per million years until , and at per million years since. The surface is at and the geotherm is steady at . The kerogen has the Green River kinetics of the text (single energy). Its kitchen, the mature part of the source rock, covers , is thick and of density , and can yield of oil per tonne of rock at full conversion; the oil has a surface density of . The oil fills a trap of whose reservoir, centred at , has a net thickness of , porosity 0.22 and water saturation 0.25, with . Use the data of the exercises; round to three significant figures.
Part I — Burial and the time–temperature index.
- Find the depth and temperature of the source rock at and today.
- Find its heating rate in each phase.
- Find the time it spent in each interval of , from to its present temperature.
- Compute its TTI today (method of the text).
- When, at what temperature and at what depth did it pass a TTI of 15?
- The same for 75 and 160.
- By the TTI, is the source rock still generating oil?
Part II — Conversion by kinetics.
- Find the rate constant at and show that less than of the kerogen can have been converted before .
- Using (30.1) with the heating rate of the second phase, find the unconverted fraction and the transformation ratio today.
- Find the temperature of half conversion at this heating rate (exercise 30.6).
- When was it reached?
- Compare with the time of peak generation given by the TTI, and explain the difference.
- Would a type II kerogen with a lower mean activation energy have converted earlier or later?
Part III — Oil generated, in place and recoverable.
- Taking a transformation ratio of 0.92, find the mass of oil generated in the kitchen.
- Find its volume at the surface.
- Find the STOIIP of the trap.
- What fraction of the oil generated does the trap hold? Keep for (15).
- Find the oil produced for a recovery factor of 0.35.
- Why is the recovery factor much less than one, and what would injecting change?
Part IV — The depleted field as a store.
- Find the temperature and hydrostatic pressure of the reservoir. Is injected supercritical there? Read its density on the figure.
- Keeping , find the reservoir volume freed by production.
- Express it as a storage efficiency factor of the pore volume of the trap, and compare with saline formations.
- A saline formation below the field covers , is thick, of porosity 0.20, with at . Find its capacity at .
- How many years of injection at the Sleipner rate would fill it?
- With and the freed volume rounded to , find the storage capacity of the depleted reservoir, in megatonnes.
Solution
Solution of Problem 30.1.
Part I. 1. At : , . Today: , . 2. , then . 3. 15–: ; each interval from 20 to : ; each from 90 to : ; 140–: . 4. Interval values , with running sums: 15–20 () 0.0065; 20–30 0.026 (0.033); 30–40 0.052 (0.085); 40–50 0.104 (0.189); 50–60 0.208 (0.397); 60–70 0.417 (0.814); 70–80 0.833 (1.65); 80–90 1.67 (3.31); 90–100 6.67 (9.98); 100–110 13.3 (23.3); 110–120 26.7 (50.0); 120–130 53.3 (103); 130–140 107 (210); 140–142.5 () 53.3: TTI today 263. 5. 15 is passed in the interval 100–, at , reached after : at and . 6. 75: , , . 160: , , . 7. No: at 263 it is past the end of oil generation (160), since about .
Part II. 8. . The rock was below for the before , so the converted fraction is less than . 9. , : and , so , and the transformation ratio is 0.917. 10. . 11. . 12. The TTI places peak generation at , the kinetics later, because the doubling rule corresponds to and weights the low temperatures too much for a kerogen of (exercise 30.5). 13. Earlier: a lower energy lowers the temperature of half conversion.
Part III. 14. Rock: ; potential ; generated . 15. . 16. . 17. , : most generated oil stays in the source rock, is lost along the migration paths or escapes to the surface. 18. . 19. About two thirds of the oil stays in the reservoir after primary and secondary recovery; injection could recover a further 10 to of the oil in place.
Part IV. 20. and : both above the critical point (, ), so the is supercritical, at about . 21. . 22. Pore volume , and , far above the 1 to of saline formations: the produced oil has emptied a known, sealed space. 23. , . 24. At a year, about 133 years. 25. : the depleted reservoir can store of .
Terms defined in this chapter
- Geological COX2 storage, trapping mechanisms, storage efficiency factor
- Geothermal system, heat in place, enthalpy classes, EGS
- Induced seismicity
- Kerogen type, van Krevelen diagram
- Recovery factor
- Unconformity-related and roll-front uranium deposits
- Unconventional reservoir
- Vitrinite reflectance, time–temperature index