
全部书籍

专业

应用 关于 Coach 登录 开始阅读

书籍暂未推出简体中文版——当前显示英文版。

Earth and Space Sciences · 术语表

什么是 Kerogen type, van Krevelen diagram?

又称: kerogen type · van Krevelen diagram

Definition 30.1 University Earth and Space Sciences — Year 2 · 第 30 章 — Energy Geology

Kerogens fall into three kerogen types by their elemental composition: type I, sapropelic, the richest in hydrogen, which generates mainly oil; type III, humic or coaly, poor in hydrogen, which generates mainly methane; and type II, intermediate, a source of both oil and gas. The van Krevelen diagram plots the atomic ratio H/C of a kerogen against its atomic ratio O/C; the types occupy different regions of it, and maturation moves a kerogen toward low H/C and low O/C.
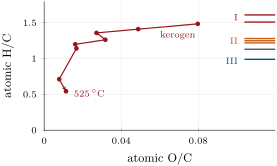
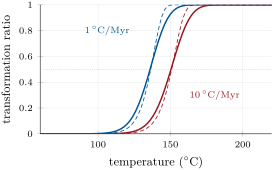
Left: a van Krevelen diagram. The red path is the Green River type I kerogen and its residues after laboratory heating at 10\, K per minute to 400–525\, C; the ticks on the right mark the H/C of seven immature kerogens of type I (red), II (orange), II/III (grey) and III (blue), whose O/C was not reported. Data: Fletcher and Pugmire (2014); Advanced Chemistry Basins Project (2004). Right: transformation ratio of the Green River kerogen heated at constant rates from 10\, C, with its distribution of activation energies (solid) and with its mean energy alone, by  (dashed).
Left: a van Krevelen diagram. The red path is the Green River type I kerogen and its residues after laboratory heating at 10 K10\,\mathrm{K} per minute to 400–525 ∘C525\,{}^{\circ}\mathrm{C}; the ticks on the right mark the H/C of seven immature kerogens of type I (red), II (orange), II/III (grey) and III (blue), whose O/C was not reported. Data: Fletcher and Pugmire (2014); Advanced Chemistry Basins Project (2004). Right: transformation ratio of the Green River kerogen heated at constant rates from 10 ∘C10\,{}^{\circ}\mathrm{C}, with its distribution of activation energies (solid) and with its mean energy alone, by (30.1) (dashed).
在原文中阅读 →