
全部书籍

专业

应用 关于 Coach 登录 开始阅读

书籍暂未推出简体中文版——当前显示英文版。

Earth and Space Sciences · 术语表

什么是 T–S diagram; water mass?

又称: T--S diagram · water mass

Definition 26.15 University Earth and Space Sciences — Year 1 · 第 26 章 — Structure of the Atmosphere and the Ocean

A T–S diagram is a plot of the potential temperature of the samples of a profile against their salinity, with the depths written along the curve and the lines of equal σθ\sigma_\theta drawn underneath. A water mass is a body of water with a common formation history, recognised by its range of potential temperature and salinity.
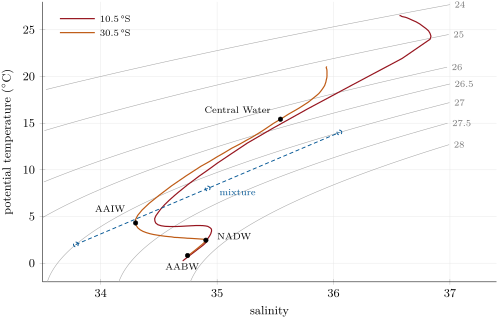
T–S diagram of the two South Atlantic columns of the profiles figure, from the surface to the sea floor, over lines of equal potential density anomaly _ (grey, labelled in kg\, m-3 at their upper ends). Dots: the cores of the water masses read on the column at 30.5 S. Blue: two waters of equal density, _ = 27.0, at 2\, C and 14\, C, and their equal-parts mixture, on the straight line between them and denser than either. Data: World Ocean Atlas 2023.
T–S diagram of the two South Atlantic columns of the profiles figure, from the surface to the sea floor, over lines of equal potential density anomaly σθ\sigma_\theta (grey, labelled in kg m−3\mathrm{kg}\,\mathrm{m}^{-3} at their upper ends). Dots: the cores of the water masses read on the column at 30.5∘S30.5{}^{\circ}\mathrm{S}. Blue: two waters of equal density, σθ=27.0\sigma_\theta = 27.0, at 2 ∘C2\,{}^{\circ}\mathrm{C} and 14 ∘C14\,{}^{\circ}\mathrm{C}, and their equal-parts mixture, on the straight line between them and denser than either. Data: World Ocean Atlas 2023.
在原文中阅读 →