Coach
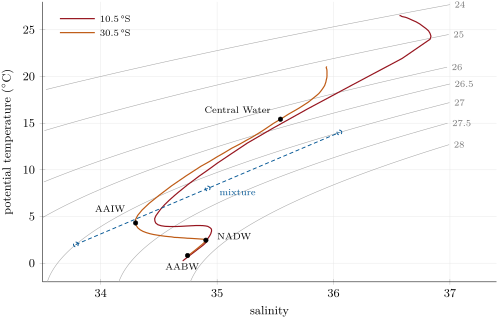
A T–S diagram is a plot of the potential temperature of the samples of a profile against their salinity, with the depths written along the curve and the lines of equal drawn underneath. A water mass is a body of water with a common formation history, recognised by its range of potential temperature and salinity.