
Physics · Glossary

What is Oscilloscope?

Also known as: oscillogram · time base · gain

Definition 8.6 High School Physics · Chapter 8 — Signals and Waves

An oscilloscope plots a voltage against time; the curve on its gridded screen is an oscillogram. Two settings convert screen divisions into physical values: the time base (seconds per horizontal division) and the vertical gain (volts per vertical division).
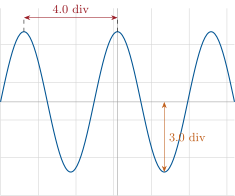
An oscillogram, time base 5\, ms/div and gain 2\, V/div: one cycle spans 4.0 divisions (T = 20\, ms, f = 50\, Hz) and the crest sits 3.0 divisions up (amplitude 6.0\, V).
An oscillogram, time base 5ms5\,\mathrm{ms}/div and gain 2V2\,\mathrm{V}/div: one cycle spans 4.04.0 divisions (T=20msT = 20\,\mathrm{ms}, f=50Hzf = 50\,\mathrm{Hz}) and the crest sits 3.03.0 divisions up (amplitude 6.0V6.0\,\mathrm{V}).

Examples

Example 8.8 (A full reading)

On the oscillogram below, the time base is 5ms5\,\mathrm{ms} per division and the gain 2V2\,\mathrm{V} per division. One cycle spans 4.04.0 divisions: T=4.0×5ms=20msT = 4.0 \times 5\,\mathrm{ms} = 20\,\mathrm{ms} and f=1/0.020s=50Hzf = 1/0.020\,\mathrm{s} = 50\,\mathrm{Hz} — the mains again. A crest sits 3.03.0 divisions above the axis: the amplitude is 3.0×2V=6.0V3.0 \times 2\,\mathrm{V} = 6.0\,\mathrm{V}.

Read in context →