
جميع الكتب

مهني

1 Markets I: The Ecosystem and Exchange-Traded Marketsالأسواق عبر الإنترنت 2 Markets II: Rates, FX and Creditالأسواق عبر الإنترنت 3 Markets III: Commodities, Energy and Cryptoالأسواق عبر الإنترنت 4 Quantitative Methodsالأساليب عبر الإنترنت 5 Derivatives and Volatilityالمشتقات عبر الإنترنت 6 Rates, Credit, XVA and Riskالفائدة والائتمان والمخاطر عبر الإنترنت 7 Research Craft: Predictors, Backtests, Measurement, Portfoliosالبحث عبر الإنترنت 8 Strategies I: Equities and Futuresالاستراتيجيات عبر الإنترنت 9 Strategies II: Volatility, Relative Value, Macro and the Bank Desksالاستراتيجيات عبر الإنترنت 10 Microstructure and Executionالتنفيذ عبر الإنترنت 11 Market Making and High-Frequency Tradingصناعة السوق عبر الإنترنت 12 Machine Learning for Marketsتعلم الآلة عبر الإنترنت 13 Low-Latency Softwareالتكنولوجيا عبر الإنترنت 14 Networks, Hardware and Trading Infrastructureالتكنولوجيا عبر الإنترنت 15 Research, Data and Risk Platformsالتكنولوجيا عبر الإنترنت 16 The Desk and the Firmالشركة عبر الإنترنت 17 The Industry: Firms, Roles and Careersالمسارات المهنية عبر الإنترنت 18 The Interview Bookالمسارات المهنية عبر الإنترنت
التطبيقات حول المدرب تسجيل الدخول ابدأ القراءة

Quantitative Finance · المسرد

ما معنى Autocovariance, autocorrelation and partial autocorrelation functions؟

يُعرف أيضًا باسم: autocovariance function · autocorrelation function · partial autocorrelation function

Definition 17.2 Quantitative Methods · الفصل 17 — Linear Time Series

For a weakly stationary process, the autocovariance function is γ(h)=Cov⁡(Xt,Xt+h)\gamma(h) = \Cov(X_t, X_{t+h}), and the autocorrelation function is ρ(h)=γ(h)/γ(0)\rho(h) = \gamma(h)/\gamma(0). The partial autocorrelation function at lag hh is the last coefficient ϕhh\phi_{hh} of the best linear predictor of Xt+hX_{t+h} from Xt+h−1,…,XtX_{t+h-1}, \dots, X_t: the correlation at lag hh once the intermediate lags are accounted for.
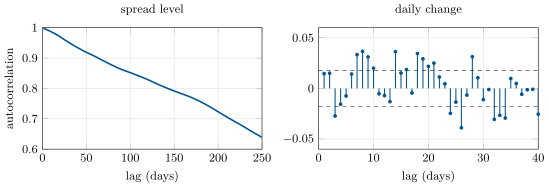
Sample autocorrelations of the 2s10s Treasury spread, 1 June 1976 to 22 September 2026 (12 574 days). Left: the level, lags 1 to 250, from 0.9987 down. Right: the daily change, lags 1 to 40, with the ± 2/√ n band. Data: FRED series DGS10 and DGS2 (Board of Governors of the Federal Reserve System, H.15).
Figure 17.1. Sample autocorrelations of the 2s10s Treasury spread, 1 June 1976 to 22 September 2026 (12 574 days). Left: the level, lags 1 to 250, from 0.9987 down. Right: the daily change, lags 1 to 40, with the ±2/n\pm 2/\sqrt n band. Data: FRED series DGS10 and DGS2 (Board of Governors of the Federal Reserve System, H.15).
اقرأ في الفصل →