
جميع الكتب

مهني

1 Markets I: The Ecosystem and Exchange-Traded Marketsالأسواق عبر الإنترنت 2 Markets II: Rates, FX and Creditالأسواق عبر الإنترنت 3 Markets III: Commodities, Energy and Cryptoالأسواق عبر الإنترنت 4 Quantitative Methodsالأساليب عبر الإنترنت 5 Derivatives and Volatilityالمشتقات عبر الإنترنت 6 Rates, Credit, XVA and Riskالفائدة والائتمان والمخاطر عبر الإنترنت 7 Research Craft: Predictors, Backtests, Measurement, Portfoliosالبحث عبر الإنترنت 8 Strategies I: Equities and Futuresالاستراتيجيات عبر الإنترنت 9 Strategies II: Volatility, Relative Value, Macro and the Bank Desksالاستراتيجيات عبر الإنترنت 10 Microstructure and Executionالتنفيذ عبر الإنترنت 11 Market Making and High-Frequency Tradingصناعة السوق عبر الإنترنت 12 Machine Learning for Marketsتعلم الآلة عبر الإنترنت 13 Low-Latency Softwareالتكنولوجيا عبر الإنترنت 14 Networks, Hardware and Trading Infrastructureالتكنولوجيا عبر الإنترنت 15 Research, Data and Risk Platformsالتكنولوجيا عبر الإنترنت 16 The Desk and the Firmالشركة عبر الإنترنت 17 The Industry: Firms, Roles and Careersالمسارات المهنية عبر الإنترنت 18 The Interview Bookالمسارات المهنية عبر الإنترنت
التطبيقات حول المدرب تسجيل الدخول ابدأ القراءة

Quantitative Finance · المسرد

ما معنى Bid-to-cover ratio and auction tail؟

يُعرف أيضًا باسم: bid-to-cover ratio · auction tail

Definition 4.4 Markets II: Rates, FX and Credit · الفصل 4 — The Treasury Market

The bid-to-cover ratio is the amount bid divided by the amount offered. The auction tail is the stop-out yield minus the when-issued yield (Definition 4.6) at the bid deadline: positive, the auction cleared cheaper than the market (it tailed); negative, richer (it stopped through).
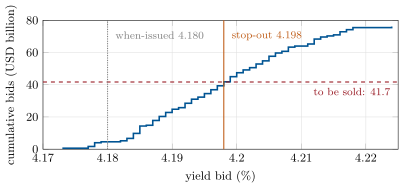
The demand curve of : bids accumulated from the lowest yield. The stop-out is where the curve crosses the amount to be sold; the gap between it and the when-issued yield at the deadline is the tail. A book whose bids sit closer to the when-issued level would stop through. Data: the chapter’s simulated bid book.
Figure 4.1. The demand curve of Example 4.5: bids accumulated from the lowest yield. The stop-out is where the curve crosses the amount to be sold; the gap between it and the when-issued yield at the deadline is the tail. A book whose bids sit closer to the when-issued level would stop through. Data: the chapter’s simulated bid book.

أمثلة

Example 4.5 (A synthetic ten-year auction)

USD 42 billion of ten-year notes are offered; USD 300 million of noncompetitive bids leave USD 41.7 billion for 76.1 billion of competitive bids. The when-issued note trades at 4.180% at 13:00. The bids of Figure 4.1 reach 41.7 billion at 4.198%: that is the stop-out, bids there are filled at 95.02%, the tail is 1.8 basis points and the bid-to-cover ratio 1.82. Indirect bidders (investors bidding through a dealer) take 51.1%, direct bidders 10.6% and dealers 38.3%. The coupon is set at 4.125%, and every winner pays 99.409 for a note that the market valued at 4.180% a minute before. The auction is simulated; the procedure is the Treasury’s.

اقرأ في الفصل →