جميع الكتب

مهني

1 Markets I: The Ecosystem and Exchange-Traded Marketsالأسواق عبر الإنترنت 2 Markets II: Rates, FX and Creditالأسواق عبر الإنترنت 3 Markets III: Commodities, Energy and Cryptoالأسواق عبر الإنترنت 4 Quantitative Methodsالأساليب عبر الإنترنت 5 Derivatives and Volatilityالمشتقات عبر الإنترنت 6 Rates, Credit, XVA and Riskالفائدة والائتمان والمخاطر عبر الإنترنت 7 Research Craft: Predictors, Backtests, Measurement, Portfoliosالبحث عبر الإنترنت 8 Strategies I: Equities and Futuresالاستراتيجيات عبر الإنترنت 9 Strategies II: Volatility, Relative Value, Macro and the Bank Desksالاستراتيجيات عبر الإنترنت 10 Microstructure and Executionالتنفيذ عبر الإنترنت 11 Market Making and High-Frequency Tradingصناعة السوق عبر الإنترنت 12 Machine Learning for Marketsتعلم الآلة عبر الإنترنت 13 Low-Latency Softwareالتكنولوجيا عبر الإنترنت 14 Networks, Hardware and Trading Infrastructureالتكنولوجيا عبر الإنترنت 15 Research, Data and Risk Platformsالتكنولوجيا عبر الإنترنت 16 The Desk and the Firmالشركة عبر الإنترنت 17 The Industry: Firms, Roles and Careersالمسارات المهنية عبر الإنترنت 18 The Interview Bookالمسارات المهنية عبر الإنترنت
التطبيقات حول المدرب تسجيل الدخول ابدأ القراءة

Quantitative Finance · المسرد

ما معنى Copula, tail dependence coefficient؟

يُعرف أيضًا باسم: copula · tail dependence coefficient

Definition 15.6 Quantitative Methods · الفصل 15 — Robust Statistics and Heavy Tails

A copula is a joint distribution function on [0,1]d[0, 1]^d with uniform margins. The lower tail dependence coefficient of (X,Y)(X, Y) with continuous margins FX,FYF_X, F_Y is λL=lim⁡q↓0P(FY(Y)≤q∣FX(X)≤q)\lambda_L = \lim_{q \downarrow 0}\P(F_Y(Y) \le q \mid F_X(X) \le q), and the upper one is defined symmetrically.
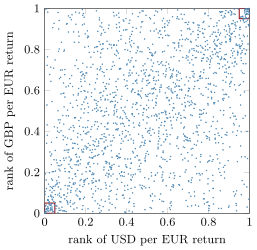
The empirical copula of daily euro returns against the dollar and the pound, 1999–2026 (every fourth day shown): each point is a day’s pair of ranks scaled to (0, 1). The squares mark the joint 5% tails, where 32% of the dollar’s worst days are also among the pound’s worst, against 20% under a Gaussian copula with the same correlation. Data: ECB euro reference rates (source: ECB statistics).
Figure 15.2. The empirical copula of daily euro returns against the dollar and the pound, 1999–2026 (every fourth day shown): each point is a day’s pair of ranks scaled to (0,1)(0, 1). The squares mark the joint 5% tails, where 32% of the dollar’s worst days are also among the pound’s worst, against 20% under a Gaussian copula with the same correlation. Data: ECB euro reference rates (source: ECB statistics).
اقرأ في الفصل →
