جميع الكتب

مهني

1 Markets I: The Ecosystem and Exchange-Traded Marketsالأسواق عبر الإنترنت 2 Markets II: Rates, FX and Creditالأسواق عبر الإنترنت 3 Markets III: Commodities, Energy and Cryptoالأسواق عبر الإنترنت 4 Quantitative Methodsالأساليب عبر الإنترنت 5 Derivatives and Volatilityالمشتقات عبر الإنترنت 6 Rates, Credit, XVA and Riskالفائدة والائتمان والمخاطر عبر الإنترنت 7 Research Craft: Predictors, Backtests, Measurement, Portfoliosالبحث عبر الإنترنت 8 Strategies I: Equities and Futuresالاستراتيجيات عبر الإنترنت 9 Strategies II: Volatility, Relative Value, Macro and the Bank Desksالاستراتيجيات عبر الإنترنت 10 Microstructure and Executionالتنفيذ عبر الإنترنت 11 Market Making and High-Frequency Tradingصناعة السوق عبر الإنترنت 12 Machine Learning for Marketsتعلم الآلة عبر الإنترنت 13 Low-Latency Softwareالتكنولوجيا عبر الإنترنت 14 Networks, Hardware and Trading Infrastructureالتكنولوجيا عبر الإنترنت 15 Research, Data and Risk Platformsالتكنولوجيا عبر الإنترنت 16 The Desk and the Firmالشركة عبر الإنترنت 17 The Industry: Firms, Roles and Careersالمسارات المهنية عبر الإنترنت 18 The Interview Bookالمسارات المهنية عبر الإنترنت
التطبيقات حول المدرب تسجيل الدخول ابدأ القراءة

Quantitative Finance · المسرد

ما معنى Errors-in-variables, attenuation bias, total least squares؟

يُعرف أيضًا باسم: errors-in-variables · attenuation bias · total least squares

Definition 16.9 Quantitative Methods · الفصل 16 — Linear Models under Stress

An errors-in-variables model observes the regressor with noise, x~=x+u\tilde x = x + u, with uu independent of xx and of the equation error. The resulting shrinkage of the OLS slope toward zero is the attenuation bias. Total least squares fits the line minimising the sum of squared perpendicular distances, which is consistent when the errors in xx and in yy have equal variances.

Sampling distributions of three hedge-ratio estimates over 2 000 simulated two-year histories: daily OLS on the noisy future prices (mean 0.683, attenuated by 0.80), the same divided by the attenuation estimated from the future’s first autocorrelation (mean 0.862, standard deviation 0.095), and OLS on weekly changes (mean 0.810, standard deviation 0.022). Data: the chapter’s tutorial, seeded.
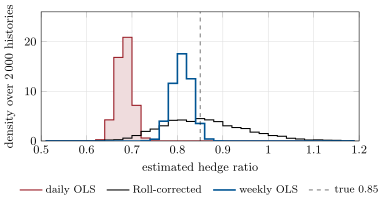
Figure 16.4. Sampling distributions of three hedge-ratio estimates over 2 000 simulated two-year histories: daily OLS on the noisy future prices (mean 0.683, attenuated by 0.80), the same divided by the attenuation estimated from the future’s first autocorrelation (mean 0.862, standard deviation 0.095), and OLS on weekly changes (mean 0.810, standard deviation 0.022). Data: the chapter’s tutorial, seeded.
اقرأ في الفصل →