جميع الكتب

مهني

1 Markets I: The Ecosystem and Exchange-Traded Marketsالأسواق عبر الإنترنت 2 Markets II: Rates, FX and Creditالأسواق عبر الإنترنت 3 Markets III: Commodities, Energy and Cryptoالأسواق عبر الإنترنت 4 Quantitative Methodsالأساليب عبر الإنترنت 5 Derivatives and Volatilityالمشتقات عبر الإنترنت 6 Rates, Credit, XVA and Riskالفائدة والائتمان والمخاطر عبر الإنترنت 7 Research Craft: Predictors, Backtests, Measurement, Portfoliosالبحث عبر الإنترنت 8 Strategies I: Equities and Futuresالاستراتيجيات عبر الإنترنت 9 Strategies II: Volatility, Relative Value, Macro and the Bank Desksالاستراتيجيات عبر الإنترنت 10 Microstructure and Executionالتنفيذ عبر الإنترنت 11 Market Making and High-Frequency Tradingصناعة السوق عبر الإنترنت 12 Machine Learning for Marketsتعلم الآلة عبر الإنترنت 13 Low-Latency Softwareالتكنولوجيا عبر الإنترنت 14 Networks, Hardware and Trading Infrastructureالتكنولوجيا عبر الإنترنت 15 Research, Data and Risk Platformsالتكنولوجيا عبر الإنترنت 16 The Desk and the Firmالشركة عبر الإنترنت 17 The Industry: Firms, Roles and Careersالمسارات المهنية عبر الإنترنت 18 The Interview Bookالمسارات المهنية عبر الإنترنت
التطبيقات حول المدرب تسجيل الدخول ابدأ القراءة

Quantitative Finance · المسرد

ما معنى Factor model؟

Definition 22.8 Quantitative Methods · الفصل 22 — Covariance Estimation and Random Matrices

A factor model of covariance is Σ=BFB⊤+D\Sigma = BF B^\top + D, with k≪Nk \ll N factor exposures BB, a factor covariance FF and a diagonal specific variance DD; statistical factor models take BB from the leading principal components of SS.

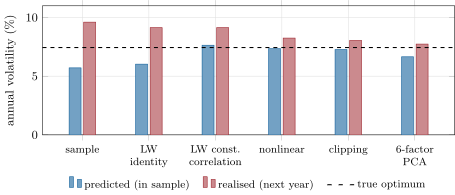
Minimum-variance portfolios of 200 stocks from six covariance estimates on two years of daily returns: the volatility each predicts and the volatility each delivers over the next year, averaged over fifty simulated histories; the dashed line is the true minimum, 7.44%. Data: the chapter’s tutorial, seeded.
Figure 22.4. Minimum-variance portfolios of 200 stocks from six covariance estimates on two years of daily returns: the volatility each predicts and the volatility each delivers over the next year, averaged over fifty simulated histories; the dashed line is the true minimum, 7.44%. Data: the chapter’s tutorial, seeded.
اقرأ في الفصل →