 Coach
CoachA historical scenario applies to today’s positions the moves the risk factors made over a past period: differences for rates and spreads, relative changes for prices.
Voorbeelden
Example 22.3 (Three episodes on one book)
Chapter 21’s book (long ten-year Treasuries, short two-year, long euros, short yen, short a EURUSD straddle), revalued in full under three periods of Treasury and ECB data:
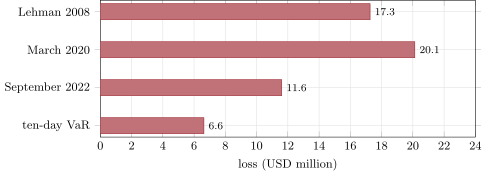
- Lehman, 12 September to 10 October 2008: two-year yield basis points, ten-year , EURUSD , USDJPY ; a loss of USD 17.26 million;
- March 2020, 6 to 20 March: and basis points, EURUSD , USDJPY ; a loss of USD 20.13 million;
- September 2022, 21 to 28 September: and basis points, EURUSD , USDJPY ; a loss of USD 11.61 million.
The ten-day 99% historical VaR scaled from chapter 21 is USD 6.63 million: every episode loses two to three times as much (Figure 22.1). The short straddle, harmless on normal days, dominates the losses in all three.