
جميع الكتب

مهني

1 Markets I: The Ecosystem and Exchange-Traded Marketsالأسواق عبر الإنترنت 2 Markets II: Rates, FX and Creditالأسواق عبر الإنترنت 3 Markets III: Commodities, Energy and Cryptoالأسواق عبر الإنترنت 4 Quantitative Methodsالأساليب عبر الإنترنت 5 Derivatives and Volatilityالمشتقات عبر الإنترنت 6 Rates, Credit, XVA and Riskالفائدة والائتمان والمخاطر عبر الإنترنت 7 Research Craft: Predictors, Backtests, Measurement, Portfoliosالبحث عبر الإنترنت 8 Strategies I: Equities and Futuresالاستراتيجيات عبر الإنترنت 9 Strategies II: Volatility, Relative Value, Macro and the Bank Desksالاستراتيجيات عبر الإنترنت 10 Microstructure and Executionالتنفيذ عبر الإنترنت 11 Market Making and High-Frequency Tradingصناعة السوق عبر الإنترنت 12 Machine Learning for Marketsتعلم الآلة عبر الإنترنت 13 Low-Latency Softwareالتكنولوجيا عبر الإنترنت 14 Networks, Hardware and Trading Infrastructureالتكنولوجيا عبر الإنترنت 15 Research, Data and Risk Platformsالتكنولوجيا عبر الإنترنت 16 The Desk and the Firmالشركة عبر الإنترنت 17 The Industry: Firms, Roles and Careersالمسارات المهنية عبر الإنترنت 18 The Interview Bookالمسارات المهنية عبر الإنترنت
التطبيقات حول المدرب تسجيل الدخول ابدأ القراءة

Quantitative Finance · المسرد

ما معنى LIBOR market model؟

Definition 8.5 Rates, Credit, XVA and Risk · الفصل 8 — Forward-Rate and Market Models

The LIBOR market model (or lognormal forward market model) makes each forward rate lognormal with a deterministic volatility under the forward measure of its payment date: dFk(t)=σk(t)Fk(t) dWkTk+1(t)dF_k(t) = \sigma_k(t)F_k(t)\,dW^{T_{k+1}}_k(t), with d⟨Wi,Wj⟩=ρij dtd\langle W_i,W_j\rangle = \rho_{ij}\,dt. Its name comes from the interbank index it was built for; the dynamics serve any tenor structure of forward-looking rates, and chapter 10 extends them to overnight-rate compounding.
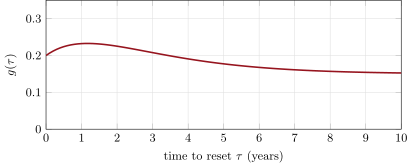
Rebonato’s volatility function with a=0.05, b=0.10, c=0.60, d=0.15: a forward’s volatility is highest about a year and a half before its reset. Scaled per forward, it makes the volatility of each forward depend on its time to reset, so the volatility curve seen in a year looks like today’s. Data: the chapter’s tutorial.
Figure 8.1. Rebonato’s volatility function with a=0.05a=0.05, b=0.10b=0.10, c=0.60c=0.60, d=0.15d=0.15: a forward’s volatility is highest about a year and a half before its reset. Scaled per forward, it makes the volatility of each forward depend on its time to reset, so the volatility curve seen in a year looks like today’s. Data: the chapter’s tutorial.
اقرأ في الفصل →