
جميع الكتب

مهني

1 Markets I: The Ecosystem and Exchange-Traded Marketsالأسواق عبر الإنترنت 2 Markets II: Rates, FX and Creditالأسواق عبر الإنترنت 3 Markets III: Commodities, Energy and Cryptoالأسواق عبر الإنترنت 4 Quantitative Methodsالأساليب عبر الإنترنت 5 Derivatives and Volatilityالمشتقات عبر الإنترنت 6 Rates, Credit, XVA and Riskالفائدة والائتمان والمخاطر عبر الإنترنت 7 Research Craft: Predictors, Backtests, Measurement, Portfoliosالبحث عبر الإنترنت 8 Strategies I: Equities and Futuresالاستراتيجيات عبر الإنترنت 9 Strategies II: Volatility, Relative Value, Macro and the Bank Desksالاستراتيجيات عبر الإنترنت 10 Microstructure and Executionالتنفيذ عبر الإنترنت 11 Market Making and High-Frequency Tradingصناعة السوق عبر الإنترنت 12 Machine Learning for Marketsتعلم الآلة عبر الإنترنت 13 Low-Latency Softwareالتكنولوجيا عبر الإنترنت 14 Networks, Hardware and Trading Infrastructureالتكنولوجيا عبر الإنترنت 15 Research, Data and Risk Platformsالتكنولوجيا عبر الإنترنت 16 The Desk and the Firmالشركة عبر الإنترنت 17 The Industry: Firms, Roles and Careersالمسارات المهنية عبر الإنترنت 18 The Interview Bookالمسارات المهنية عبر الإنترنت
التطبيقات حول المدرب تسجيل الدخول ابدأ القراءة

Quantitative Finance · المسرد

ما معنى Low-risk anomaly, betting against beta؟

يُعرف أيضًا باسم: low-risk anomaly · betting against beta

Definition 6.3 Strategies I: Equities and Futures · الفصل 6 — Value, Quality and Low Risk

The low-risk anomaly is the observation that low-beta and low-volatility stocks have earned higher risk-adjusted returns than high-beta and high-volatility stocks: the security market line is flatter than the capital asset pricing model predicts. Betting against beta exploits it with a portfolio long low-beta stocks levered to a beta of one and short high-beta stocks delevered to a beta of one.
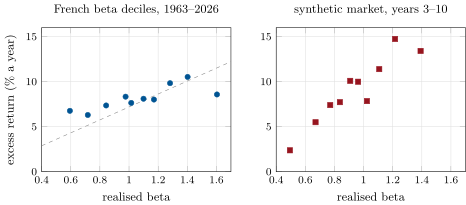
Realised beta and average return of beta-sorted deciles. Left: Kenneth French’s value-weighted portfolios formed on beta, excess returns over Treasury bills, with the line the capital asset pricing model implies at the market’s 7.2% (derived statistics; the raw series is not redistributed). Right: the synthetic market’s trailing-beta deciles, total returns. Data: s1_fetch_value.py, s1_factors.sml.
Figure 6.2. Realised beta and average return of beta-sorted deciles. Left: Kenneth French’s value-weighted portfolios formed on beta, excess returns over Treasury bills, with the line the capital asset pricing model implies at the market’s 7.2% (derived statistics; the raw series is not redistributed). Right: the synthetic market’s trailing-beta deciles, total returns. Data: s1_fetch_value.py, s1_factors.sml.
اقرأ في الفصل →