جميع الكتب

مهني

1 Markets I: The Ecosystem and Exchange-Traded Marketsالأسواق عبر الإنترنت 2 Markets II: Rates, FX and Creditالأسواق عبر الإنترنت 3 Markets III: Commodities, Energy and Cryptoالأسواق عبر الإنترنت 4 Quantitative Methodsالأساليب عبر الإنترنت 5 Derivatives and Volatilityالمشتقات عبر الإنترنت 6 Rates, Credit, XVA and Riskالفائدة والائتمان والمخاطر عبر الإنترنت 7 Research Craft: Predictors, Backtests, Measurement, Portfoliosالبحث عبر الإنترنت 8 Strategies I: Equities and Futuresالاستراتيجيات عبر الإنترنت 9 Strategies II: Volatility, Relative Value, Macro and the Bank Desksالاستراتيجيات عبر الإنترنت 10 Microstructure and Executionالتنفيذ عبر الإنترنت 11 Market Making and High-Frequency Tradingصناعة السوق عبر الإنترنت 12 Machine Learning for Marketsتعلم الآلة عبر الإنترنت 13 Low-Latency Softwareالتكنولوجيا عبر الإنترنت 14 Networks, Hardware and Trading Infrastructureالتكنولوجيا عبر الإنترنت 15 Research, Data and Risk Platformsالتكنولوجيا عبر الإنترنت 16 The Desk and the Firmالشركة عبر الإنترنت 17 The Industry: Firms, Roles and Careersالمسارات المهنية عبر الإنترنت 18 The Interview Bookالمسارات المهنية عبر الإنترنت
التطبيقات حول المدرب تسجيل الدخول ابدأ القراءة

Quantitative Finance · المسرد

ما معنى Merton fraction؟

Definition 9.9 Quantitative Methods · الفصل 9 — Stochastic Control

The Merton fraction is π∗=(μ−r)/(γσ2)\pi^* = (\mu - r)/(\gamma\sigma^2).

Certainty-equivalent return of a constant fraction in equities for a CRRA investor with = 3 (= 7\%, r = 2\%, = 18\%): a parabola peaking at the Merton fraction (left dot, 51.4%), flat enough that 60% (right dot) costs only 3.6 bp a year. The Kelly fraction, optimal for = 1, is 154%. Data: closed form, the chapter’s tutorial.
Figure 9.1. Certainty-equivalent return of a constant fraction in equities for a CRRA investor with γ=3\gamma = 3 (μ=7%\mu = 7\%, r=2%r = 2\%, σ=18%\sigma = 18\%): a parabola peaking at the Merton fraction (left dot, 51.4%), flat enough that 60% (right dot) costs only 3.6 bp a year. The Kelly fraction, optimal for γ=1\gamma = 1, is 154%. Data: closed form, the chapter’s tutorial.
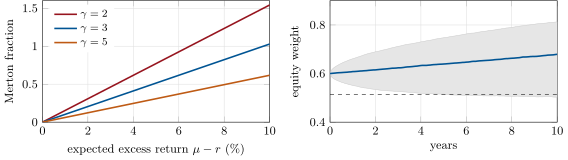
Left: the Merton fraction against the expected excess return, for three risk aversions (= 18\%): ten points of fraction per point of return at = 3. Right: the equity weight of a fund that starts at 60% and never rebalances, median and 10th–90th percentile band over 20 000 simulated paths, against the Merton fraction (dashed). Data: the chapter’s tutorial, seeded.
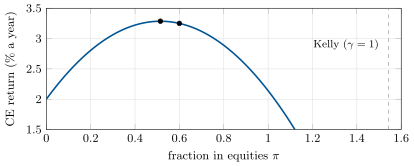
Figure 9.2. Left: the Merton fraction against the expected excess return, for three risk aversions (σ=18%\sigma = 18\%): ten points of fraction per point of return at γ=3\gamma = 3. Right: the equity weight of a fund that starts at 60% and never rebalances, median and 10th–90th percentile band over 20 000 simulated paths, against the Merton fraction (dashed). Data: the chapter’s tutorial, seeded.
اقرأ في الفصل →
