
جميع الكتب

مهني

1 Markets I: The Ecosystem and Exchange-Traded Marketsالأسواق عبر الإنترنت 2 Markets II: Rates, FX and Creditالأسواق عبر الإنترنت 3 Markets III: Commodities, Energy and Cryptoالأسواق عبر الإنترنت 4 Quantitative Methodsالأساليب عبر الإنترنت 5 Derivatives and Volatilityالمشتقات عبر الإنترنت 6 Rates, Credit, XVA and Riskالفائدة والائتمان والمخاطر عبر الإنترنت 7 Research Craft: Predictors, Backtests, Measurement, Portfoliosالبحث عبر الإنترنت 8 Strategies I: Equities and Futuresالاستراتيجيات عبر الإنترنت 9 Strategies II: Volatility, Relative Value, Macro and the Bank Desksالاستراتيجيات عبر الإنترنت 10 Microstructure and Executionالتنفيذ عبر الإنترنت 11 Market Making and High-Frequency Tradingصناعة السوق عبر الإنترنت 12 Machine Learning for Marketsتعلم الآلة عبر الإنترنت 13 Low-Latency Softwareالتكنولوجيا عبر الإنترنت 14 Networks, Hardware and Trading Infrastructureالتكنولوجيا عبر الإنترنت 15 Research, Data and Risk Platformsالتكنولوجيا عبر الإنترنت 16 The Desk and the Firmالشركة عبر الإنترنت 17 The Industry: Firms, Roles and Careersالمسارات المهنية عبر الإنترنت 18 The Interview Bookالمسارات المهنية عبر الإنترنت
التطبيقات حول المدرب تسجيل الدخول ابدأ القراءة

Quantitative Finance · المسرد

ما معنى Out-of-sample R-squared, predictability ceiling؟

يُعرف أيضًا باسم: out-of-sample R-squared · predictability ceiling

Definition 1.5 Machine Learning for Markets · الفصل 1 — Why Financial Machine Learning Is Different

The out-of-sample R-squared of forecasts y^i\hat y_i of returns yiy_i on a test set is

Roos2=1−∑i(yi−y^i)2∑iyi2,R^2_{\mathrm{oos}} = 1 - \frac{\sum_i(y_i - \hat y_i)^2}{\sum_i y_i^2},

measured against a forecast of zero, not against the sample mean. The predictability ceiling of a dataset is Roos2R^2_{\mathrm{oos}} of the true conditional expectation μ(xi)=E[yi∣xi]\mu(x_i) = \E[y_i\mid x_i]: the best any model of those features can score.

500 stocks, ceiling 0.60% out of samplestrong signal, Bayes 0.95
modelin sampleout of samplecorr. with the truthin sampleout of sample
ridge regression0.39%0.38%0.740.720.72
boosted trees1.45%0.57%0.920.920.92
neural network0.64%0.28%0.740.940.93
Table 1.1. Three models on two tasks: twenty years of training and ten of test on firm.mlsynth’s 500 stocks, and 20 000 training examples of a task with a strong signal. R-squared against zero for the stocks, against the mean for the generic task. Data: ml_why.compare and ml_why.strong_signal.
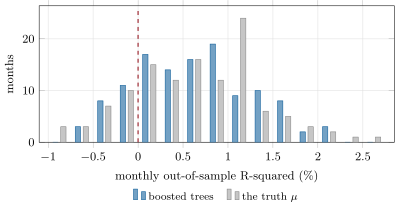
The 120 test months, one R-squared per month over 500 stocks, for the boosted trees and for the planted truth itself. Bars left of the dashed line are months where the forecast did worse than zero: 18% of them for the model, and some for the truth. Data: ml_why.compare on firm.mlsynth.
Figure 1.2. The 120 test months, one R-squared per month over 500 stocks, for the boosted trees and for the planted truth itself. Bars left of the dashed line are months where the forecast did worse than zero: 18% of them for the model, and some for the truth. Data: ml_why.compare on firm.mlsynth.
اقرأ في الفصل →