 Coach
CoachThe out-of-sample R-squared of forecasts of returns on a test set is
measured against a forecast of zero, not against the sample mean. The predictability ceiling of a dataset is of the true conditional expectation : the best any model of those features can score.
| 500 stocks, ceiling 0.60% out of sample | strong signal, Bayes 0.95 | ||||
| model | in sample | out of sample | corr. with the truth | in sample | out of sample |
| ridge regression | 0.39% | 0.38% | 0.74 | 0.72 | 0.72 |
| boosted trees | 1.45% | 0.57% | 0.92 | 0.92 | 0.92 |
| neural network | 0.64% | 0.28% | 0.74 | 0.94 | 0.93 |
firm.mlsynth’s 500 stocks, and 20 000 training examples of a task with a strong signal. R-squared against zero for the stocks, against the mean for the generic task. Data: ml_why.compare and ml_why.strong_signal.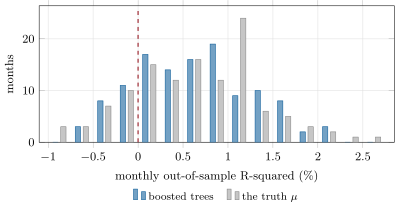
ml_why.compare on firm.mlsynth.