
Todos os livros

Profissional

Apps Sobre Coach Entrar Começar a ler

Quantitative Finance · Glossário

O que é Out-of-sample R-squared, predictability ceiling?

Também chamado de: out-of-sample R-squared · predictability ceiling

Definition 1.5 Machine Learning for Markets · Capítulo 1 — Why Financial Machine Learning Is Different

The out-of-sample R-squared of forecasts y^i\hat y_i of returns yiy_i on a test set is

Roos2=1−∑i(yi−y^i)2∑iyi2,R^2_{\mathrm{oos}} = 1 - \frac{\sum_i(y_i - \hat y_i)^2}{\sum_i y_i^2},

measured against a forecast of zero, not against the sample mean. The predictability ceiling of a dataset is Roos2R^2_{\mathrm{oos}} of the true conditional expectation μ(xi)=E[yi∣xi]\mu(x_i) = \E[y_i\mid x_i]: the best any model of those features can score.

500 stocks, ceiling 0.60% out of samplestrong signal, Bayes 0.95
modelin sampleout of samplecorr. with the truthin sampleout of sample
ridge regression0.39%0.38%0.740.720.72
boosted trees1.45%0.57%0.920.920.92
neural network0.64%0.28%0.740.940.93
Table 1.1. Three models on two tasks: twenty years of training and ten of test on firm.mlsynth’s 500 stocks, and 20 000 training examples of a task with a strong signal. R-squared against zero for the stocks, against the mean for the generic task. Data: ml_why.compare and ml_why.strong_signal.
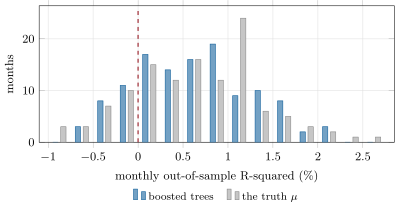
The 120 test months, one R-squared per month over 500 stocks, for the boosted trees and for the planted truth itself. Bars left of the dashed line are months where the forecast did worse than zero: 18% of them for the model, and some for the truth. Data: ml_why.compare on firm.mlsynth.
Figure 1.2. The 120 test months, one R-squared per month over 500 stocks, for the boosted trees and for the planted truth itself. Bars left of the dashed line are months where the forecast did worse than zero: 18% of them for the model, and some for the truth. Data: ml_why.compare on firm.mlsynth.
Ler no capítulo →