جميع الكتب

مهني

1 Markets I: The Ecosystem and Exchange-Traded Marketsالأسواق عبر الإنترنت 2 Markets II: Rates, FX and Creditالأسواق عبر الإنترنت 3 Markets III: Commodities, Energy and Cryptoالأسواق عبر الإنترنت 4 Quantitative Methodsالأساليب عبر الإنترنت 5 Derivatives and Volatilityالمشتقات عبر الإنترنت 6 Rates, Credit, XVA and Riskالفائدة والائتمان والمخاطر عبر الإنترنت 7 Research Craft: Predictors, Backtests, Measurement, Portfoliosالبحث عبر الإنترنت 8 Strategies I: Equities and Futuresالاستراتيجيات عبر الإنترنت 9 Strategies II: Volatility, Relative Value, Macro and the Bank Desksالاستراتيجيات عبر الإنترنت 10 Microstructure and Executionالتنفيذ عبر الإنترنت 11 Market Making and High-Frequency Tradingصناعة السوق عبر الإنترنت 12 Machine Learning for Marketsتعلم الآلة عبر الإنترنت 13 Low-Latency Softwareالتكنولوجيا عبر الإنترنت 14 Networks, Hardware and Trading Infrastructureالتكنولوجيا عبر الإنترنت 15 Research, Data and Risk Platformsالتكنولوجيا عبر الإنترنت 16 The Desk and the Firmالشركة عبر الإنترنت 17 The Industry: Firms, Roles and Careersالمسارات المهنية عبر الإنترنت 18 The Interview Bookالمسارات المهنية عبر الإنترنت
التطبيقات حول المدرب تسجيل الدخول ابدأ القراءة

Quantitative Finance · المسرد

ما معنى Spot measure, terminal measure؟

يُعرف أيضًا باسم: spot measure · terminal measure

Definition 8.6 Rates, Credit, XVA and Risk · الفصل 8 — Forward-Rate and Market Models

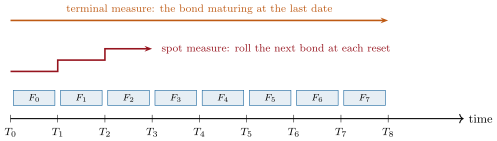
The spot measure Qd\mathbb Q^d of a tenor structure has as numeraire the discretely rebalanced bank account Bd(t)=P(t,Tm(t))∏j<m(t)(1+δjFj(Tj))B_d(t) = P(t,T_{m(t)})\prod_{j<m(t)}(1+\delta_jF_j(T_j)), which holds the bond maturing at the next reset date Tm(t)T_{m(t)} and rolls into the next one at each reset. The terminal measure is the forward measure of the last payment date TnT_n, with numeraire P(t,Tn)P(t,T_n).

A tenor structure of eight annual forwards and the numeraires of the two common simulation measures. Under the spot measure each forward’s drift sums over the forwards between the next reset and itself; under the terminal measure, over those after it.
Figure 8.2. A tenor structure of eight annual forwards and the numeraires of the two common simulation measures. Under the spot measure each forward’s drift sums over the forwards between the next reset and itself; under the terminal measure, over those after it.

أمثلة

Example 8.8 (Caplets come back)

Ten annual forwards from chapter 2’s euro OIS curve (1.98% for the first year rising to 3.03% for the tenth), caplet volatilities of 70 basis points normal converted to Black (33.0% at one year down to 23.1% at nine), Rebonato’s function with the parameters of Figure 8.1 and correlation ρij=e−0.1∣i−j∣\rho_{ij}=e^{-0.1|i-j|}: 20 000 paths under the spot measure, four steps a year, reprice the at-the-money caplets to within two standard errors (Figure 8.3).

اقرأ في الفصل →