
جميع الكتب

مهني

1 Markets I: The Ecosystem and Exchange-Traded Marketsالأسواق عبر الإنترنت 2 Markets II: Rates, FX and Creditالأسواق عبر الإنترنت 3 Markets III: Commodities, Energy and Cryptoالأسواق عبر الإنترنت 4 Quantitative Methodsالأساليب عبر الإنترنت 5 Derivatives and Volatilityالمشتقات عبر الإنترنت 6 Rates, Credit, XVA and Riskالفائدة والائتمان والمخاطر عبر الإنترنت 7 Research Craft: Predictors, Backtests, Measurement, Portfoliosالبحث عبر الإنترنت 8 Strategies I: Equities and Futuresالاستراتيجيات عبر الإنترنت 9 Strategies II: Volatility, Relative Value, Macro and the Bank Desksالاستراتيجيات عبر الإنترنت 10 Microstructure and Executionالتنفيذ عبر الإنترنت 11 Market Making and High-Frequency Tradingصناعة السوق عبر الإنترنت 12 Machine Learning for Marketsتعلم الآلة عبر الإنترنت 13 Low-Latency Softwareالتكنولوجيا عبر الإنترنت 14 Networks, Hardware and Trading Infrastructureالتكنولوجيا عبر الإنترنت 15 Research, Data and Risk Platformsالتكنولوجيا عبر الإنترنت 16 The Desk and the Firmالشركة عبر الإنترنت 17 The Industry: Firms, Roles and Careersالمسارات المهنية عبر الإنترنت 18 The Interview Bookالمسارات المهنية عبر الإنترنت
التطبيقات حول المدرب تسجيل الدخول ابدأ القراءة

Quantitative Finance · المسرد

ما معنى Student-t copula؟

Definition 15.10 Rates, Credit, XVA and Risk · الفصل 15 — Portfolio Credit

In the Student-t copula with ν\nu degrees of freedom the latent variables are Xi=W(ρ Z+1−ρ εi)X_i = \sqrt W(\sqrt\rho\,Z+\sqrt{1-\rho}\,\varepsilon_i) with W=ν/χν2W = \nu/\chi^2_\nu common to all names; a name defaults if Xi<tν−1(pi)X_i < t_\nu^{-1}(p_i). The common scale WW makes the names default together in bad draws: the copula has tail dependence, which the Gaussian lacks.
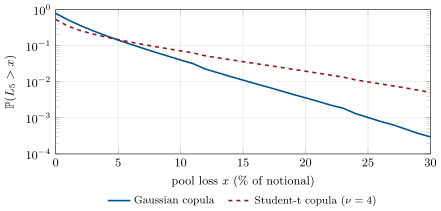
Probability that the five-year pool loss exceeds x (log scale), same marginals and asset correlation 25%, simulated with 400 000 draws of the factors. The Student-t copula puts several times more probability on large losses. Data: the chapter’s tutorial.
Figure 15.4. Probability that the five-year pool loss exceeds xx (log scale), same marginals and asset correlation 25%, simulated with 400 000 draws of the factors. The Student-t copula puts several times more probability on large losses. Data: the chapter’s tutorial.

أمثلة

Example 15.11 (Tails)

At an asset correlation of 25%, the probability that the pool loses more than 12% in five years is 2.24% under the Gaussian copula and 5.23% under the Student-t copula with four degrees of freedom; for a loss above 24%, 0.13% against 1.13%, 8.6 times more (Figure 15.4). Senior tranches priced with the Gaussian copula at one correlation look cheap for the same reason the skew exists: the market prices more tail than the Gaussian gives.

اقرأ في الفصل →