Low-Latency Software · Technology
26Build: Tick-to-Trade, Measured
A packet leaves the simulated exchange on two lines at once. A few microseconds later the feed handler has it, a microsecond after that the strategy has decided, and an order leaves for the venue through the risk gate and the order gateway. Every one of those steps has been built and measured in isolation in this book; this chapter puts them on one path, on four threads of one machine, and times the whole thing with a stamp at every boundary. The result is the latency budget of chapter 1 with the guesses replaced by measurements: which stage costs what, at the median and in the tail, and where a real server would have to be different. The answer on this laptop is sobering in one place and reassuring in another. The code the book has written takes a few hundred nanoseconds; the kernel, the network stack and a shared machine take the rest, and the rest is most of it.
26.1 Assembling the path
The path is the book’s components in order (Figure 26.1). An exchange thread replays the recorded line: the small-tick day of chapter 19, 6 000 events in 1 200 MoldUDP64 packets, sent over UDP on the loopback interface on line A and, five microseconds later, on line B, at twenty times its recorded spacing (a packet every ). A feed thread receives both lines and runs the feed handler of chapter 18, which arbitrates them and publishes each event on a ring (chapter 12). An engine thread takes each event off the ring and runs firm.ticktotrade’s Path: the strategy engine of chapter 20, with its book builder (chapter 19), then, for each order it decides, the risk gate of chapter 22 and the order gateway of chapter 21, which writes the venue’s binary message (chapter 16) and sends it on a TCP session. A venue thread receives the session’s frames. Each thread is pinned to its own CPU (chapter 4), and nothing on the path allocates after warm-up (chapter 6): the harness counts, and finds zero in every run.

The path is checked before it is timed. The C++ test replays the same events offline through the same Path and obtains 1 050 orders (new orders, replaces and cancels) whose hash is committed; the Rust twin, assembled from the Rust feed handler, engine, risk gate and gateway, produces the same hash; and the live harness, with its threads, sockets and arbitration between two lines, produces it again, in every run. What is timed is therefore the path that computes the right orders.
    template <class Send>
    void on_event(const strat::Event& e, std::uint64_t (*now)(), Stamp* st, Send&& send) {
        const std::size_t first = engine_.actions.size();
        engine_.stamp = now;
        one_[0] = e;
        engine_.run(one_);
        if (now && st) st->t[Book] = engine_.book_stamp, st->t[Decide] = now();
        for (std::size_t i = first; i < engine_.actions.size(); ++i)
            act(engine_.actions[i], now, st, send);
}26.2 Instrumentation points and stage timestamps
Definition 26.1 (Instrumentation point, latency attribution)
An instrumentation point is a place in a path where the time is read and recorded with the identity of the message passing it. Latency attribution divides a message’s end-to-end latency into the intervals between consecutive instrumentation points, so that each part is charged to the stage that spent it.
Every point reads the time-stamp counter (chapter 5), which all cores of this machine share, so that a reading on the feed thread and one on the engine thread are comparable. The ten points of Figure 26.1 give eight stages: receive, from the exchange’s sendto to the feed thread’s recv, the kernel’s UDP path on the loopback interface; decode, the handler’s arbitration and normalisation until the event is on the ring; ring, the wait on the ring; book, strategy, risk and gateway on the engine thread; and transmit, from the written message to the venue thread’s receipt, the kernel’s TCP path. The stamps travel with the event (in the ring’s message) and with the order (in a preallocated record), and the exchange’s and venue’s stamps are joined afterwards by packet sequence number and client order identifier (Listing 26.2). Two traps shaped the design. Reading the clock is not free: each point costs some with rdtscp (chapter 5), so the points are few and none is inside a loop. And when an event causes two orders, the second waits for the first to be sent, a few microseconds that the naive attribution charges to its risk check; the stages are therefore attributed on the first order of each event, and the end-to-end figures on every order.
        for (;;) {
            if (ring_in.try_read(&m, sizeof m) < 0) {
                if (feed_done.load(std::memory_order_acquire) && ring_in.try_read(&m, sizeof m) < 0)
                    break;
                continue;
            }
            if (n_ev++ == cfg.warmup_events)
                alloc_mark.store(static_cast<long long>(firm::arena::allocations()));
            Stamp st;
            st.t[Recv] = m.recv, st.t[Pub] = m.pub, st.t[Pop] = tsc();
            st.pkt_seq = m.pkt_seq, st.line = m.line;
            int nth = 0;
            auto send = [&](const std::uint8_t* msg, std::size_t n, char, std::uint64_t) {
                frame[0] = static_cast<std::uint8_t>((n + 1) >> 8);  // SoupBinTCP: length, 'U', message
                frame[1] = static_cast<std::uint8_t>(n + 1);
                frame[2] = 'U';
                std::memcpy(frame + 3, msg, n);
                ::send(cli, frame, n + 3, 0);
                OrderStamp os;
                os.s = st;
                os.s.t[Sent] = tsc();
                os.nth = nth++;  // a second order of the same event has waited for the first one's send
                res.orders.push_back(os);
            };
            path.on_event(m.e, &tsc, &st, send);
}26.3 The budget against the measurement
Figure 26.2 gives the stages over ten runs, 5 250 first orders (10 500 in all), on this laptop with no isolated cores, the machine otherwise idle. The book’s own code is fast: the book update takes about at the median, the strategy about 100, the risk gate about 50 and the gateway about 30, all well under a microsecond at the 99th percentile. The decode stage, about , includes waiting for the earlier messages of the same packet: five events arrive together and leave one after another. The ring’s median of about is the same queueing, on the engine side, behind the orders of the previous events. The kernel’s stages dwarf the rest: receiving a UDP packet on the loopback interface takes about , sending the order over TCP about , and in the tail the ring waits milliseconds whenever the engine thread is preempted on its CPU (by the kernel, the hypervisor or any other task), which no user-space code can prevent on a machine that has not isolated it (chapter 13).
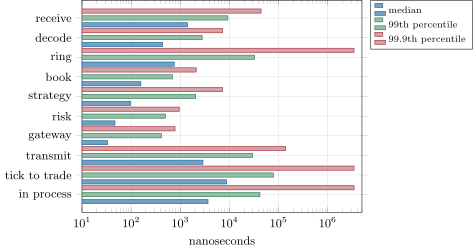
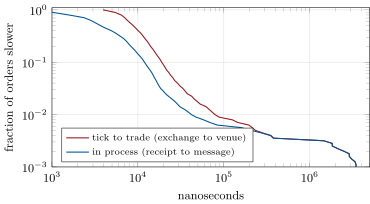
bench_t2t.py.End to end, from the exchange’s send of a packet to the venue’s receipt of the order it caused, the median is about ; in the process, from the packet’s receipt to the order’s message, about (Figure 26.3). The distributions have the shape the book has predicted since chapter 1: a tight body and a tail three orders of magnitude further out, set by the machine rather than the code. Table 26.1 checks chapter 1’s three-microsecond budget with firm.latbudget: the strategy and the risk gate meet their targets; the book and the decode miss theirs (the book by a third, the decode because of the packet’s queue), and the kernel’s receive and transmit miss by factors of 1.6 and 3.6, as they were bound to: the budget assumed a kernel-bypass network card.
bench_t2t.py.| stage (median) | budget (ns) | measured (ns) | |
|---|---|---|---|
| receive | 900 | 1 400 | over |
| decode | 60 | 440 | over |
| book | 120 | 160 | over |
| strategy | 200 | 100 | within |
| risk | 50 | 47 | within |
| transmit | 800 | 2 900 | over |
| end to end | 3 000 | 7 400 | over |
firm.latbudget (medians; the end to end composed from the first orders’ stages). Data: bench_t2t.py.26.4 What a tuned server would change
Three changes separate this laptop from a trading server, and each targets a part of the table. A kernel-bypass network card removes the system calls from the data path: the ef_vi interface of one vendor’s adapters, for example, gives the application “direct access” to the adapter’s datapath, with data path operations that “do not require system calls”; chapter 1’s budget assumed to receive and to transmit on such a path, card and wire included. Isolated cores (chapter 13) keep other work off the path’s CPUs, which is what the tail of the ring stage is made of. And the path itself can be shortened: the packet’s queue behind the decode and the ring disappears if events are handed over as a batch or if the feed thread runs the strategy for simple cases, and the book’s is the ladder of chapter 19 on a small-tick instrument with a per-event engine call that the batch would amortise.
Replacing the measured receive and transmit by the budget’s kernel-bypass figures and keeping the measured in-process stages gives a projected median of about : for the network, plus about for decode, ring, book, strategy, risk and gateway, of which the queueing in decode and ring is some two-thirds. That misses the three-microsecond budget by the queue, which is the next thing to remove, and not by any of the components the book has built. The projection is arithmetic on a stated assumption, not a measurement; the measurement on the target server is the only proof, and the harness of this chapter is how it is taken.
26.5 Tutorial: run the path, read the budget
Goal. Check the assembled path, run it live on the loopback interface, and read its stages against the budget. End state: Figures 26.2 and 26.3, the budget table, and green tests in C++ and Rust.
- The line.
make_t2t_fixtures.pyencodes the small-tick day as the simulator’s feed; the C++ test checks that the feed handler turns it back into the same 6 000 events. - Offline. The C++ and Rust tests replay the events through the path and obtain the committed orders.
- Live.
firm_ticktotrade_live_test.cppruns the four threads once and checks the orders, the order of the stamps and the absence of allocation;python bench_t2t.pyruns ten pinned runs and writes the stages, the distributions and the budget report.
What to change next. Hand the events of a packet to the engine as one batch and measure the decode and ring stages again; pin two threads on the two hyperthreads of one core and watch the stages that share it.
26.6 Build: tick-to-trade
Purpose. The book’s components assembled into one trading path with its measurement harness: the proof that they compute the right orders together, and the measurement of what each costs.
Interface. C++20 firm::t2t: Path(tick) with on_event(event, now, stamp, send), out, order_hash, read_events, Stamp; run_live(Config) returning Result with the orders’ stamps, the orders, the counts and the allocations after warm-up. Rust firm_ticktotrade: Path, events_from_line, order_hash. Python: make_t2t_fixtures.py; the chapter’s ll_t2t.py computes the stages and checks the budget with firm.latbudget.
Rules. The live path and the offline replay produce the same orders; every stamp is taken outside any loop, in path order; no allocation after warm-up; the stages attributed on the first order of each event.
Acceptance tests. code/firm/ticktotrade/: the recorded line decoded to the book builder’s events; the offline orders equal to the committed hash in C++ and in Rust, with no allocation in a second pass; one live run with the same orders, every order’s stamps in order and received by the venue, and no allocation after warm-up.
Stretch. The simulator’s live server (Book 10) as the venue, with acknowledgements through the gateway’s state machine; a batched hand-over from the feed thread; hardware time stamps from a network card; the harness on a tuned server.
Sources and further reading
- Xilinx (AMD), ef_vi User Guide, SF-114063-CD, issue 10, 2019.
26.7 Exercises
Exercise 26.1 ★
Using the medians of Figure 26.2, what share of the in-process time is spent in the book’s own components (book, strategy, risk, gateway)?
Solution
Solution of Exercise 26.1.
Book, strategy, risk and gateway take at their medians, under a quarter of the that the in-process stages add up to (decode and ring included), and under a tenth of the in-process median over all orders, which includes the waits of second orders.
Exercise 26.2 ★
Why must the clock read at each instrumentation point be the same counter on every core, and what would go wrong with a per-thread clock?
Solution
Solution of Exercise 26.2.
A stage is the difference of two readings taken on different threads, often on different cores. The time-stamp counter is one counter, invariant and synchronised across the cores of this machine (chapter 5), so the difference is a duration. Per-thread clocks with different offsets or rates would make stages drift, and some would come out negative.
Exercise 26.3 ★
Five events arrive in one packet and each takes about to decode and publish. What decode stage do the five events see on average, and why does the ring stage show the same effect?
Solution
Solution of Exercise 26.3.
The -th event of the packet is published after , so the five see 100 to 500, on average . On the engine side the same five events are taken one after another, each waiting for the handling of the ones before it, and for their orders’ sends.
Exercise 26.4 ★★
An event causes two orders, each sent in about . If the stages were attributed on every order, which stage would absorb the wait of the second, and by how much would its median move?
Solution
Solution of Exercise 26.4.
The risk stage, measured from the decision to the check of the second order: it would include the whole send of the first order, about . With half of the orders in that case, the stage’s median would land between the two groups, anywhere from the check’s own tens of nanoseconds to the send’s microseconds: the attribution would be wrong, not the gate.
Exercise 26.5 ★★
Recompute the projection of the last section if the queueing in decode and ring were removed entirely. Does the projected path meet the three-microsecond budget?
Solution
Solution of Exercise 26.5.
Keeping about of decoding proper: , within the budget, with about to spare.
Exercise 26.6 ★★
The receive stage includes the exchange thread’s sendto. Why can this harness not separate the sender’s system call from the receiver’s, and what would a hardware time stamp on the wire change?
Solution
Solution of Exercise 26.6.
Both stamps are taken by software around system calls: the exchange’s before sendto, the feed thread’s after recv, so the stage contains the sender’s call, the kernel’s loopback path and the receiver’s call, with no reading in between. A hardware time stamp taken by the card when the packet is on the wire splits it into the sender’s part and the receiver’s part, and on a real network adds the wire itself.
Exercise 26.7 ★★★
Coding. Hand the events of a packet to the engine as one ring message and run the engine on the batch. Check that the orders are unchanged and measure the decode and ring stages again.
Solution
Solution of Exercise 26.7.
One ring message per packet with up to five events; the engine runs them in order, so the orders are unchanged (the test’s hash checks it). The decode stage of all but the last event disappears, since the batch is published at once, and the ring stage loses the per-message overhead; the queue behind earlier orders’ sends remains.
Exercise 26.8 ★★★
Find the flaw. “Our tick-to-trade is : we time from the moment our code gets the packet to the moment we call send, and we report the average.”
Solution
Solution of Exercise 26.8.
It measures only the in-process part, leaving out the network card, the kernel’s receive and transmit (on this laptop, most of the total) and the wire; it stops at the call to send, not when the order leaves; and an average says nothing about the tail, where races are lost. Report the percentiles of the interval from the packet on the wire to the order on the wire.
26.8 Problem: The Budget, Proven
Problem 26.1
Weekend problem — the path of the book, stage by stage
Use Figure 26.2 and Table 26.1 (measured_stages.csv, measured_budget.csv).
Part I — The measurement.
- List the eight stages and the instrumentation points that bound each.
- Give the median, 99th and 99.9th percentiles of the tick-to-trade and in-process latencies.
- Which stage has the largest median, and which the largest 99.9th percentile?
- Why is the 99.9th percentile of the ring stage so far from its median on this laptop?
Part II — The check.
- Which stages meet chapter 1’s budget at the median, and which miss it, by what factor?
- Why is the budget’s end-to-end figure composed from the stages of the first orders rather than taken from the tick-to-trade distribution?
- Why do the percentiles of the stages not add up to the percentile of the total?
- What does the check establish that the functional tests do not?
Part III — The projection.
- Replace the receive and transmit stages by the budget’s kernel-bypass figures and compute the projected median.
- Which part of the remaining gap is queueing, and which is computation?
- What would isolated cores change in the figure, and what would they not change?
- Why is the projection not a measurement, and what would make it one?
Part IV — The verdict.
- State the named result: the measured median, 99th and 99.9th percentiles per stage and end to end on this laptop, and the projected median for a tuned server.
- How much of the in-process median is the code this book wrote, and how much is waiting?
- Which chapter’s technique addresses each of the three largest contributions?
- Why do the offline and live paths have to produce the same orders before any timing is trusted?
- Why is the absence of allocation checked in every run?
- What would you measure first on a production server?
- Which result of the book would you distrust most if this harness had not been built?
- In one sentence: what does it take to know a latency, rather than to believe it?
Solution
Solution of Problem 26.1.
- Receive (exch to recv), decode (recv to pub), ring (pub to pop), book (pop to book), strategy (book to decide), risk (decide to risk), gateway (risk to encode), transmit (encode to venue).
- Tick to trade: about , and ; in process: about , and .
- Transmit has the largest median (about ); the ring the largest 99.9th percentile (about ).
- When the engine thread’s CPU is taken away (the kernel, the hypervisor, another task), events wait on the ring until the thread runs again: the machine’s scheduling, not the code.
- The strategy and the risk gate meet their targets; decode misses by a factor of about 7, book by a third, receive by 1.6 and transmit by 3.6.
- The stages of one order compose exactly into its own total; using the first orders keeps the composition consistent with the stage attribution, while the tick-to-trade distribution includes the second orders’ waits.
- Quantiles of a sum are not sums of quantiles (chapter 1): the slow cases of different stages rarely coincide, and when they do, they are not the same messages.
- That the path meets, or does not meet, a stated performance target on stated hardware, stage by stage: a property of the system that no functional test sees.
- at the median.
- About two-thirds of the in process is queueing (the packet’s events waiting for each other in decode and on the ring); the rest is computation, of which the book’s components take about .
- They would remove the preemption that makes the ring’s tail; they would not change the medians of the computation, nor the kernel’s receive and transmit.
- It adds figures from a budget to measured ones; only a run of this harness on the target server, with its card and its tuning, measures it.
- Named result. On this laptop, otherwise idle, over 10 500 orders: receive about 1.4, decode 0.44, ring 0.76, book 0.16, strategy 0.10, risk 0.05, gateway 0.03 and transmit at the median; tick to trade about at the median, at the 99th and at the 99.9th percentile; projected for a tuned server with kernel bypass, about at the median, without the packet’s queue.
- About of computation by the book’s components against some of decoding and waiting in the of first-order stages; the in-process median of all orders, , is mostly waiting.
- Transmit and receive: kernel bypass (chapter 13 and One Quant Book 14); the ring’s tail: core isolation (chapter 13); the queue: batching the hand-over (chapters 12 and 18).
- Otherwise the timing could be of a path that computes something else, or that skips work when something goes wrong.
- An allocation on the path is a latency hazard (chapter 6) that a change can introduce silently; the count catches it on the next run.
- The receive and transmit stages with hardware time stamps, and the tails with the path’s CPUs isolated.
- The per-component figures of the earlier chapters: each was measured alone, with warm caches and no neighbours.
- Measure it on the path that computes the right answer, stage by stage, with one clock, in percentiles.
26.9 Interview questions
Interview question 26.1 ★ developer
What is tick-to-trade latency, and where exactly do you start and stop the clock?
Solution
Solution of Interview question 26.1.
The time from the market event reaching the firm (ideally, the packet on the wire at the network card) to the resulting order leaving it (the order on the wire). Start and stop with hardware time stamps where possible; otherwise say exactly which software points are used and what they leave out.
What the interviewer is looking for: wire to wire, and honesty about the points.
Interview question 26.2 ★★ developer
How would you instrument a trading path to find out which stage is slow, without making it slower?
Solution
Solution of Interview question 26.2.
Read one shared, cheap clock (the time-stamp counter) at a few stage boundaries, carry the readings with the message in preallocated records, write them out off the hot path (a binary log), and join them by message identity afterwards; attribute stages per message and report percentiles.
What the interviewer is looking for: few points, one clock, off-path recording, per-message attribution.
Interview question 26.3 ★★ developer
Your median tick-to-trade is fine but the 99.9th percentile is a thousand times larger. Where do you look?
Solution
Solution of Interview question 26.3.
At what the path waits for rather than what it computes: preemption and interrupts on its CPUs (isolation), page faults and allocation, queues behind bursts, the kernel’s network stack, garbage collection or logging on the path. The stage whose tail grows tells which.
What the interviewer is looking for: scheduling and queueing before code.
Interview question 26.4 ★★ developer
Walk through a packet’s path from the network card to your strategy and back out, with a latency for each step on a tuned server.
Solution
Solution of Interview question 26.4.
Wire to card and DMA, then a kernel-bypass receive (under a microsecond); decode tens of nanoseconds; book and strategy tens to a few hundred; risk tens; encode tens; kernel-bypass send and card to wire (under a microsecond). A few microseconds in all, most of it in the network path.
What the interviewer is looking for: per-stage orders of magnitude, and where the time goes.
Interview question 26.5 ★★ developer, trader
The strategy team asks for a latency budget. How do you write it, and how do you prove it is met?
Solution
Solution of Interview question 26.5.
From the competitive requirement at the percentiles that matter, allocated to stages with the union bound for the tails (chapter 1); proved by a harness that stamps every stage on the production path and checks every release against the budget.
What the interviewer is looking for: targets per stage and percentile, and a harness that checks them.
Interview question 26.6 ★★★ developer
Design the measurement harness for a production trading system: what is stamped, where, with which clock, how the stamps are joined, and how the results reach the people who need them.
Solution
Solution of Interview question 26.6.
Hardware time stamps at the card for wire in and out; the time-stamp counter at each stage boundary, calibrated against a UTC-traceable clock; stamps carried with the message and written to a binary log by a separate thread; joined by sequence number and order identifier; per-stage histograms per release, with alerts on the tails; the same harness in the performance gate.
What the interviewer is looking for: clocks, joins, histograms, and the link to the release process.