All books

Professional

Apps About Coach Log in Start reading

Chemistry · Glossary

What is Predominance and distribution diagrams?

Also known as: predominance diagram · distribution diagram

Definition 45.2 School Chemistry — Grades 1 to 12 · Chapter 45 — Buffers and Predominance Diagrams

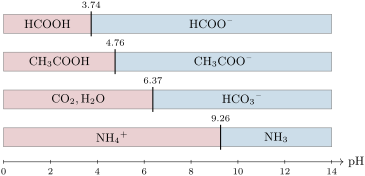
The predominance diagram of a couple is a pH axis divided at pKapK_a: below, the acid HA predominates ([HA]>[AX−][\ce{HA}] > [\ce{A-}]), above, the base AX−\ce{A-}. The distribution diagram shows the fraction of each form, [HA]/c[\ce{HA}]/c and [AX−]/c[\ce{A-}]/c, against the pH; the two curves cross at pH=pKa\mathrm{pH} = pK_a.

Predominance diagrams of four couples: the acid (left, red) dominates below its pK_a, the base (right, blue) above.
Predominance diagrams of four couples: the acid (left, red) dominates below its pKapK_a, the base (right, blue) above.
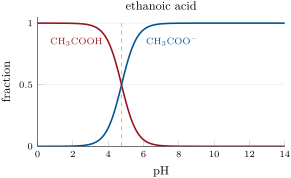
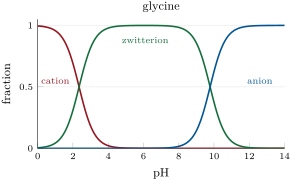
Distribution diagrams, computed from the pK_a values. Left: ethanoic acid, the curves cross at 4.76. Right: glycine, H2N-CH2-COOH, with two couples (pK_a 2.35 and 9.78): the cation H3N+-CH2-COOH, the zwitterion H3N+-CH2-COO- and the anion H2N-CH2-COO-.
Distribution diagrams, computed from the pKapK_a values. Left: ethanoic acid, the curves cross at 4.76. Right: glycine, HX2N−CHX2−COOH\ce{H2N-CH2-COOH}, with two couples (pKapK_a 2.35 and 9.78): the cation HX3NX+−CHX2−COOH\ce{H3N+-CH2-COOH}, the zwitterion HX3NX+−CHX2−COOX−\ce{H3N+-CH2-COO-} and the anion HX2N−CHX2−COOX−\ce{H2N-CH2-COO-}.
Read in context →
Definition 10.7 University Chemistry — Year 1 · Chapter 10 — Acid–Base Equilibria and the Predominant-Reaction Method

For a couple HA/A, pH=pKa+log⁡([A]/[HA])\mathrm{pH} = \mathrm{p}K_a + \log([\mathrm{A}]/[\mathrm{HA}]): the acid predominates ([HA]>[A][\mathrm{HA}] > [\mathrm{A}]) for pH<pKa\mathrm{pH} < \mathrm{p}K_a, the base for pH>pKa\mathrm{pH} > \mathrm{p}K_a. The predominance diagram is the pH axis divided at each pKa\mathrm{p}K_a into the domains where each form predominates. The distribution diagram gives the fraction of each form, [form]/C[\text{form}]/C, as a function of pH.

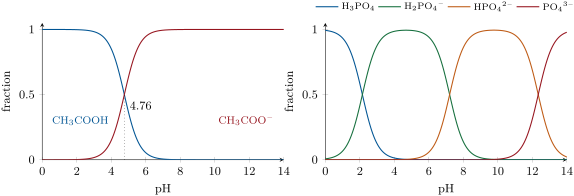
Distribution diagrams of ethanoic acid (left) and phosphoric acid (right), and the predominance diagram of phosphoric acid. Each crossing of two neighbouring curves lies at a pK_a; the ampholytes H2PO4- and HPO42- are almost the only form at the middle of their domains. Distribution diagrams of ethanoic acid (left) and phosphoric acid (right), and the predominance diagram of phosphoric acid. Each crossing of two neighbouring curves lies at a pK_a; the ampholytes H2PO4- and HPO42- are almost the only form at the middle of their domains.
Distribution diagrams of ethanoic acid (left) and phosphoric acid (right), and the predominance diagram of phosphoric acid. Each crossing of two neighbouring curves lies at a pKa\mathrm{p}K_a; the ampholytes HX2POX4X−\ce{H2PO4-} and HPOX4X2−\ce{HPO4^{2-}} are almost the only form at the middle of their domains.
Read in context →