সব বই

পেশাদার

1 Markets I: The Ecosystem and Exchange-Traded Marketsবাজার অনলাইন 2 Markets II: Rates, FX and Creditবাজার অনলাইন 3 Markets III: Commodities, Energy and Cryptoবাজার অনলাইন 4 Quantitative Methodsপদ্ধতি অনলাইন 5 Derivatives and Volatilityডেরিভেটিভস অনলাইন 6 Rates, Credit, XVA and Riskসুদহার, ঋণ ও ঝুঁকি অনলাইন 7 Research Craft: Predictors, Backtests, Measurement, Portfoliosগবেষণা অনলাইন 8 Strategies I: Equities and Futuresকৌশল অনলাইন 9 Strategies II: Volatility, Relative Value, Macro and the Bank Desksকৌশল অনলাইন 10 Microstructure and Executionএক্সিকিউশন অনলাইন 11 Market Making and High-Frequency Tradingমার্কেট মেকিং অনলাইন 12 Machine Learning for Marketsমেশিন লার্নিং অনলাইন 13 Low-Latency Softwareপ্রযুক্তি অনলাইন 14 Networks, Hardware and Trading Infrastructureপ্রযুক্তি অনলাইন 15 Research, Data and Risk Platformsপ্রযুক্তি অনলাইন 16 The Desk and the Firmপ্রতিষ্ঠান অনলাইন 17 The Industry: Firms, Roles and Careersক্যারিয়ার অনলাইন 18 Interviews I: Maths, Probability and Speedক্যারিয়ার অনলাইন 19 Interviews II: Markets, Trading Games and the Final Roundক্যারিয়ার অনলাইন 20 Interviews III: Codeক্যারিয়ার অনলাইন
অ্যাপ পরিচিতি Coach সাইন ইন পড়া শুরু করো

বইগুলো এখনো বাংলা ভাষায় পাওয়া যায় না — ইংরেজি সংস্করণ দেখানো হচ্ছে।

Earth and Space Sciences · পরিভাষা

Contour line and contour interval কী?

অন্য নাম: contour line · contour interval

Definition 32.7 Primary & Middle School Earth and Space Sciences · অধ্যায় 32 — Maps of the Whole Earth

A contour line is a line on a map joining points of the ground at the same altitude. The contour interval is the difference in altitude between two neighbouring contour lines; it is the same all over the map.
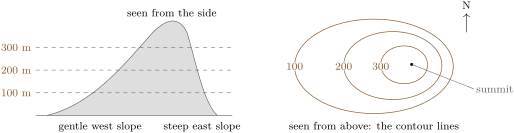
A hill sliced every 100\, m (a sketch). Seen from above, each slice gives a closed contour line around the summit. Where the slope is steep (east), the lines are close together; where it is gentle (west), they are far apart.
A hill sliced every 100 m100\,\mathrm{m} (a sketch). Seen from above, each slice gives a closed contour line around the summit. Where the slope is steep (east), the lines are close together; where it is gentle (west), they are far apart.
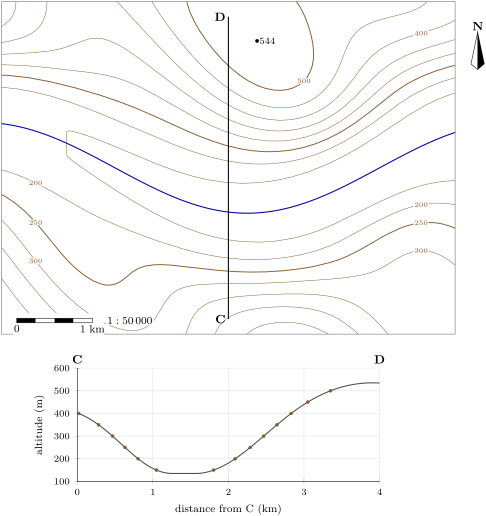
Top: a topographic map of part of the Varden Hills at 1 : 50\,000 (1 cm on the map for 500\, m on the ground). Contour interval 50\, m; the index contours, thicker, are at 250 and 500\, m. The river flows east along a flat valley floor. Bottom: the topographic profile along C–D, from south to north; the dots are the points where C–D crosses a contour line (the vertical scale is stretched three times).
Top: a topographic map of part of the Varden Hills at 1:50 0001 : 50\,000 (1 cm on the map for 500 m500\,\mathrm{m} on the ground). Contour interval 50 m50\,\mathrm{m}; the index contours, thicker, are at 250 and 500 m500\,\mathrm{m}. The river flows east along a flat valley floor. Bottom: the topographic profile along C–D, from south to north; the dots are the points where C–D crosses a contour line (the vertical scale is stretched three times).
প্রসঙ্গসহ পড়ো →
