书籍暂未推出简体中文版——当前显示英文版。
Primary & Middle School Earth and Space Sciences · 1–9 年级
32Maps of the Whole Earth
On many classroom wall maps, Greenland looks about as big as Africa. On a globe, Africa is about fourteen times larger: about 29 million square kilometres for the African mainland, against about 2.1 million for Greenland. Both are true pictures of the Earth, made with care. So which one is lying, and why?
You already know
A map is a drawing of a place seen from above, smaller than the place, with a legend and a scale (Chapter 4). A globe is a small model of the round Earth; a world map shows the whole Earth flat, in one picture (Chapter 6). Parallels and meridians give every place its latitude and longitude (Chapter 14). Altitude is the height above sea level, and a physical map shows the relief in colours (Chapter 9). In physics, you learn that light travels at about per second.
32.1 Why a flat map has to distort
Try to flatten the peel of an orange on a table: it tears or it stretches. The surface of a sphere cannot be laid flat without changing some lengths. To draw the whole Earth on a sheet, a mapmaker chooses a rule that sends every point of the globe to a point of the sheet, and chooses what the map will keep true, and what it will give up.
Definition 32.1 (Map projection)
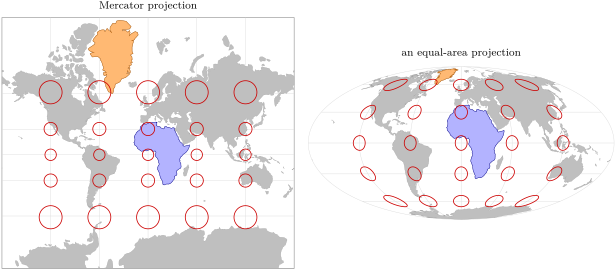
A map projection is a rule that sends every point of the globe, given by its latitude and longitude, to a point of a flat map. On a Mercator projection, the parallels and the meridians are straight lines crossing at right angles, and the shape of every small region is kept, but areas are enlarged more and more towards the poles. On an equal-area projection, every region keeps its true area compared with the others, but shapes are bent, more and more towards the edges of the map.
The figure below draws the same equal circles on the globe, all of the same size, onto both maps. On the Mercator map, the circles stay round but grow towards the poles: at latitude , their area is four times what it is at the equator, and near Greenland’s middle, at about , about ten times. On the equal-area map, the circles all keep the same area, but those far from the centre are squashed into ovals.
No projection is the best for everything. The Mercator projection was made for sailors: a course that keeps the same compass direction is a straight line on it. To compare the sizes of countries, of forests or of deserts, an equal-area map tells the truth. Before trusting a world map, it is worth asking which projection it uses.
Example 32.2 (Greenland and Africa)
Africa’s mainland covers about 29 million , Greenland about 2.1 million : . Africa straddles the equator, where the Mercator projection hardly enlarges anything, while most of Greenland lies between about and north, where areas are enlarged from 4 to more than 10 times. On the Mercator map, the two come out about the same size.
32.2 Scale
A map of a valley or a town is so small a piece of the Earth that the projection hardly matters. What matters is how much smaller than the ground the map is.
Definition 32.3 (Numerical scale and scale bar)
The numerical scale of a map is a ratio such as : one centimetre on the map stands for centimetres on the ground, and the same for any unit. A scale bar is a ruler drawn on the map, marked with the distances on the ground.
Method 32.4 (Using a numerical scale)
- Measure the distance on the map, in centimetres.
- Multiply it by the number after the colon: the result is the distance on the ground, in centimetres.
- Convert: divide by 100 for metres, by for kilometres.
Example 32.5 (A walk on a map)
On a map at , a footpath measures . On the ground, it is cm, that is or . Each centimetre of the map stands for .
The scale bar has one advantage over the numerical scale: when a map is enlarged or shrunk on a screen or a copier, the bar is enlarged or shrunk with it and stays right, while the ratio printed in the corner becomes wrong.
32.3 The topographic map
A physical map shows the relief with colours. A map of a small area shows it far more precisely, with lines.
Definition 32.6 (Topographic map)
A topographic map is a detailed map of a small area, at a scale such as or , that shows the shape and the height of the ground, with the rivers, roads, paths, buildings and woods.
Definition 32.7 (Contour line and contour interval)
A contour line is a line on a map joining points of the ground at the same altitude. The contour interval is the difference in altitude between two neighbouring contour lines; it is the same all over the map.
Imagine a hill sliced by horizontal planes, one every . Each slice cuts the hill along a closed line; seen from above, these lines are the contour lines.
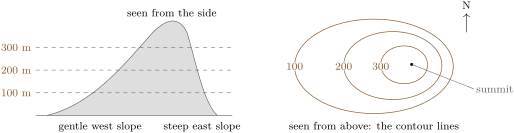
A topographic map is read with a few rules.
- Contour lines never cross: a point has only one altitude.
- The closer the contour lines, the steeper the slope; far apart, the ground is gentle; no line at all, it is nearly flat.
- Closed lines nested inside one another, rising inwards, mark a hill; its top is often marked by a dot with its altitude, a spot height.
- Where a contour line crosses a valley, it bends upstream, in a V that points towards the head of the valley.
- Every fifth line, the index contour, is drawn thicker and labelled with its altitude.
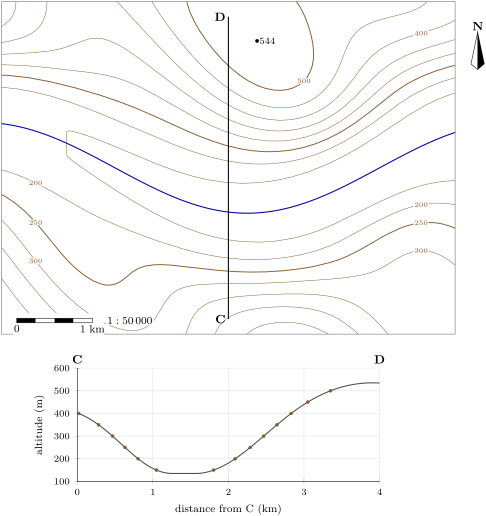
The slope of the ground between two points is the rise divided by the horizontal distance, often written as a percentage. On the map below, going north from the river, the and contours on line C–D are about apart: the slope is about , or .
Method 32.8 (Drawing a topographic profile)
- Draw the line of the profile on the map, from one end (C) to the other (D).
- Lay the straight edge of a strip of paper along the line; mark C, D, and every point where the line crosses a contour line, with its altitude.
- Draw a horizontal axis as long as C–D (the distances) and a vertical axis of altitudes.
- Carry each mark to the graph, at its distance from C and at its altitude, and join the points with a smooth curve: rounded on hill tops, flat along a valley floor.
32.4 Satellite images of the Earth
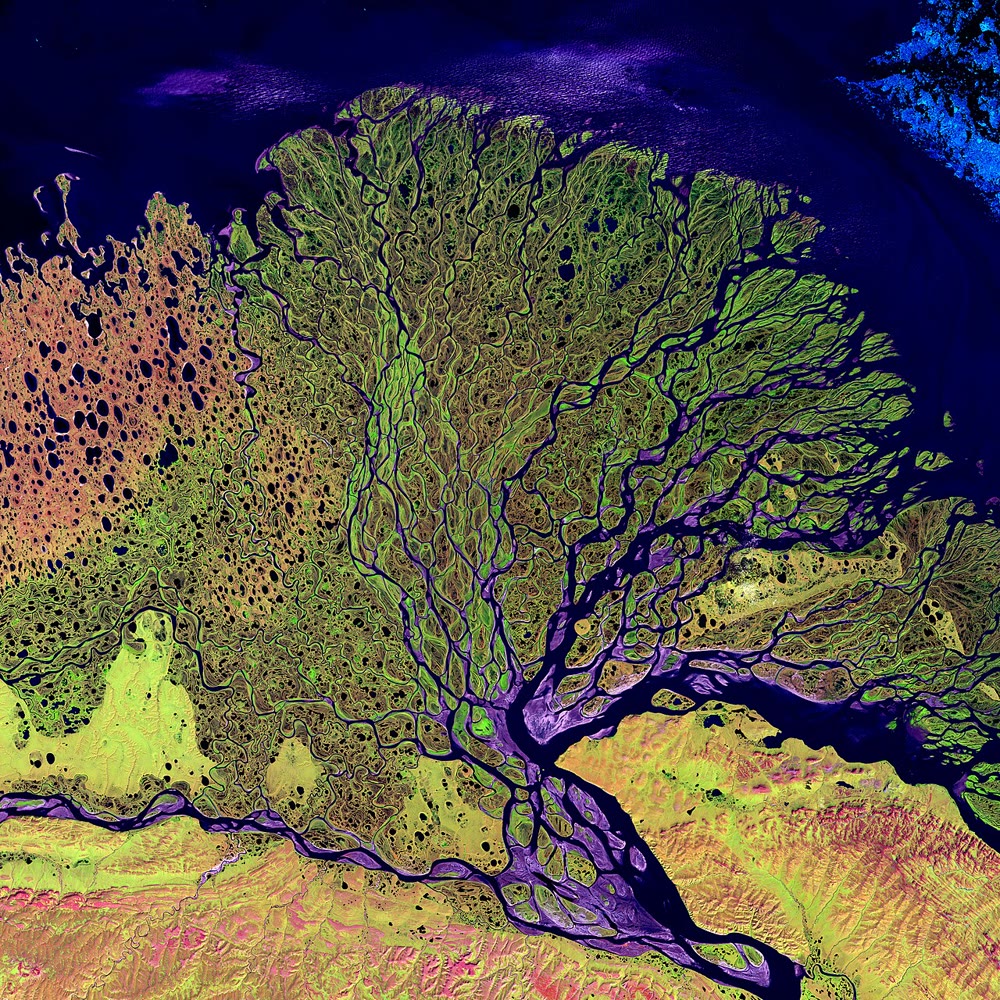
On 23 July 1972, a rocket launched the first satellite built to study the Earth’s surface, later called Landsat 1. Circling the Earth 14 times a day at , from pole to pole, it passed over the same place every 18 days and, in six years, took images of about three quarters of the Earth’s surface. Landsat satellites have imaged the land without a break ever since.
Definition 32.9 (Remote sensing and satellite image)
Remote sensing is the observation of the Earth from a distance, from aircraft or from satellites, by measuring the light and other radiation that the surface sends back. A satellite image is a picture of part of the Earth built from these measurements.
A satellite camera sees more than our eyes: it also measures infrared light, which is invisible. Shown in colours on the image (a false-colour image), the infrared reveals plants, wet ground or bare rock. Images of the same place taken years apart show how a coast, a forest, a glacier or a town changes (Chapter 27).
32.5 Satellite positioning
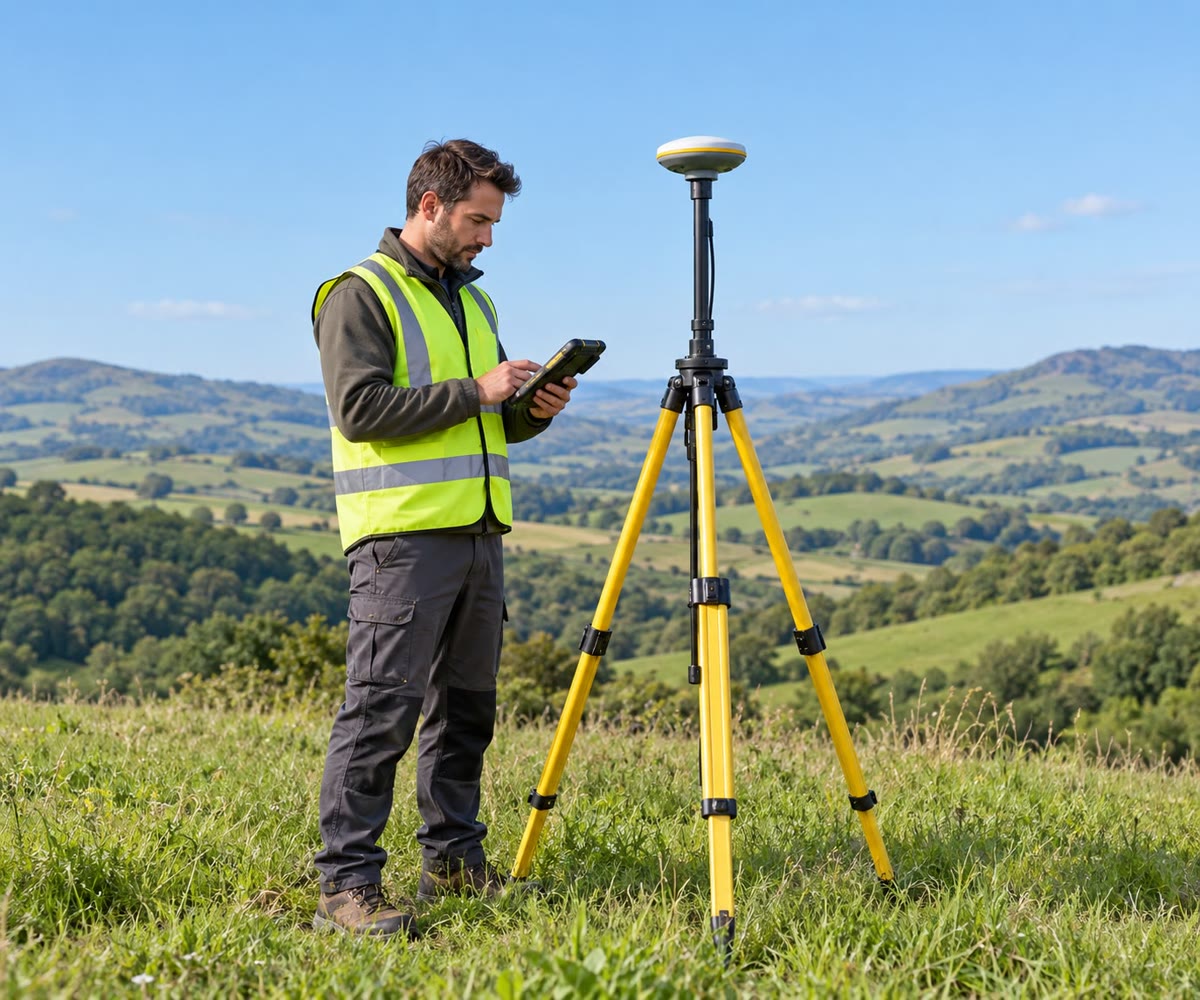
A phone or a car can tell where it is to within a few metres, almost anywhere on the Earth. It does not see the satellites; it listens to them.
Definition 32.10 (Satellite positioning)
Satellite positioning is finding a position on the Earth from the distances to several satellites whose positions are known. A receiver computes each distance from the time a signal from the satellite takes to reach it.
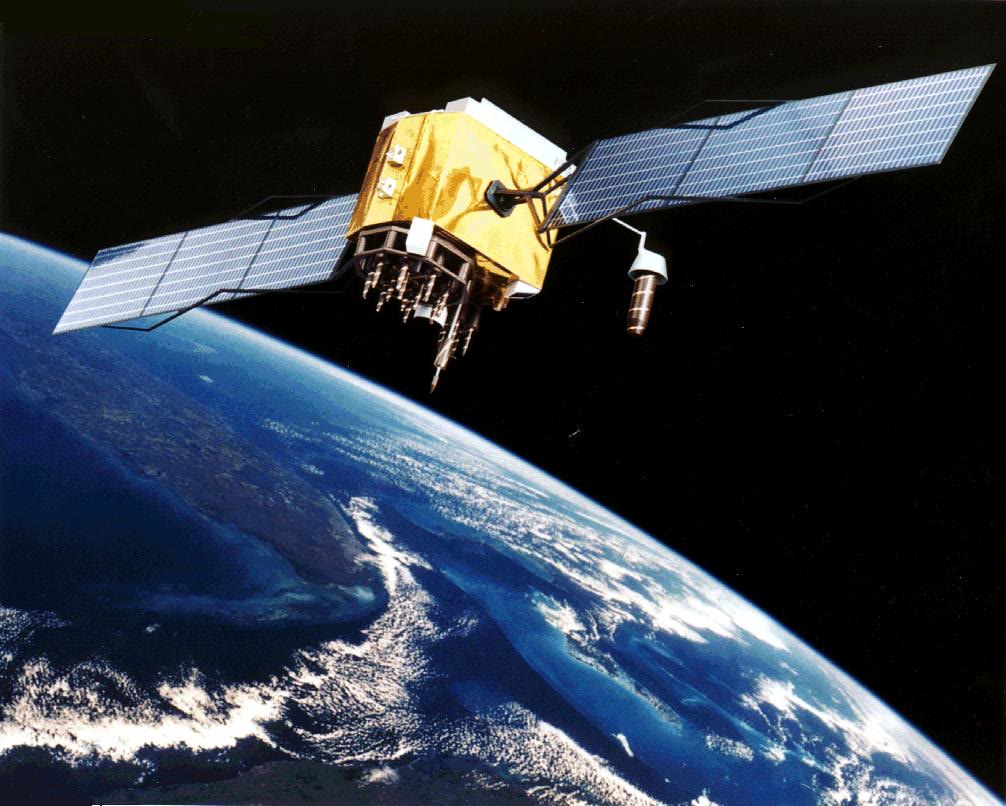
The American system, GPS, keeps at least 24 working satellites at an altitude of about . Each circles the Earth twice a day, in six orbits spread around the planet, so that from almost any point on the Earth at least four satellites are in view. A signal from away, travelling at the speed of light, arrives after s: the receiver measures this time and turns it into a distance.
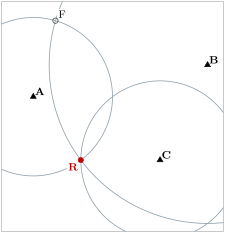
How do distances give a position? Picture the idea on a flat map. If the receiver is from beacon A, it lies somewhere on a circle of radius around A. If it is also from B, it lies on both circles: at one of the two points where they cross. A third distance, from C, picks the right one. In space, the circles become spheres, and one more satellite is needed for the same reason.
32.6 Exercises
Exercise 32.1 ★
Give the word for each description. (a) A rule that sends each point of the globe to a point of a flat map. (b) A line joining points at the same altitude. (c) A ratio such as . (d) The difference in altitude between two neighbouring contour lines. (e) Observing the Earth from a distance, for example from a satellite.
Solution
Solution of Exercise 32.1.
(a) A map projection. (b) A contour line. (c) A numerical scale. (d) The contour interval. (e) Remote sensing.
Exercise 32.2 ★
Convert each map distance into a distance on the ground, in metres or kilometres. (a) on a map. (b) on a map. (c) on a map. (d) On a map, how many centimetres stand for ?
Solution
Solution of Exercise 32.2.
(a) cm . (b) cm . (c) cm . (d) cm; .
Exercise 32.3 ★
True or false? Correct the false sentences. (a) A world map can show the whole Earth without distorting anything. (b) On a Mercator map, Greenland looks bigger than it is. (c) On an equal-area map, shapes are kept everywhere. (d) A scale bar stays right when a map is enlarged on a copier.
Exercise 32.4 ★
On a topographic map, (a) what does it mean when contour lines are very close together? (b) far apart? (c) What do closed contour lines rising inwards show? (d) Why can two contour lines never cross?
Exercise 32.5 ★★
On a Mercator map, areas at latitude are enlarged 4 times, and at latitude about 1.33 times, compared with the equator. (a) A lake of at N is drawn on the map. A lake at the equator drawn with the same size has what true area? (b) Two islands of the same true area lie at and at . How many times larger does the second look than the first? (c) Why can the Mercator map never show the poles?
Solution
Solution of Exercise 32.5.
(a) At N the lake is drawn 4 times too large: it looks as large as . At the equator areas are not enlarged, so the lake drawn with the same size has a true area of . (b) times larger. (c) Areas, and distances north to south, grow without limit towards the poles: the poles would be infinitely far from the equator.
Exercise 32.6 ★★
Use the topographic map of the Varden Hills in this chapter. (a) What is the contour interval? (b) What is the altitude of the summit marked by its spot height, and of the index contour just around it? (c) The river flows east. Is the valley floor higher in the west or in the east of the map? (d) Along C–D, north of the river, between which contour lines are the lines closest together? What does that tell you about the slope there?
Solution
Solution of Exercise 32.6.
(a) . (b) The summit is at ; the index contour around it is the line. (c) In the west: a river flows downhill, so its floor is lower downstream, to the east. (d) Between about the 300 and the lines: there the slope is steepest, gentler both near the valley floor and near the summit.
Exercise 32.7 ★★
Use the profile C–D in this chapter. (a) At about what altitude are C and D? (b) What is the lowest altitude along the profile, and how far from C is it? (c) How long is the flat valley floor along C–D? (d) The profile is drawn with its vertical scale stretched three times. Why do mapmakers often do this?
Exercise 32.8 ★★
On a map, a path crosses the contour and then the contour, further on. (a) What is the horizontal distance between the two points on the ground? (b) How much does the path climb? (c) What is the slope, as a percentage? (d) Further on, two contours apart in altitude are apart on the map. Is the path steeper or gentler there? By how much?
Solution
Solution of Exercise 32.8.
(a) cm . (b) . (c) , a slope of . (d) Gentler: is , so the slope is , half as steep.
Exercise 32.9 ★★
Landsat 1 circled the Earth 14 times a day and passed over the same place every 18 days. (a) How many orbits did it make between two passes over the same place? (b) Each orbit took 103 minutes. How long, in hours, are 14 orbits? (c) Built to work one year, it was switched off on 6 January 1978, five and a half years after its launch. How many times its planned life did it work? (d) Give one change on the Earth’s surface that images of the same place taken years apart can show.
Exercise 32.10 ★★
A GPS satellite is about away; its signal travels at about per second. (a) How long does the signal take to arrive? Write the answer in scientific notation. (b) If a receiver’s clock were wrong by s, what error in the distance would that make? (c) What does this tell you about the clocks used in satellite positioning?
Solution
Solution of Exercise 32.10.
(a) s s. (b) . (c) A tiny error of time makes a huge error of distance: the clocks have to be extremely precise.
Exercise 32.11 ★★★
On a flat map with a grid in kilometres, beacon A is at and beacon B at . A receiver is from A and from B. (a) Show that the point is from A and from B. (b) Give another point at the same distances from A and B. (c) A third beacon C is at , and the receiver is about from it. Which of the two points is the receiver? (d) Why does satellite positioning need several satellites?
Solution
Solution of Exercise 32.11.
(a) Distance to A: ; distance to B: . (b) , the mirror image across the line AB. (c) Distance from C to : ; to : . The receiver is at . (d) One distance gives a circle (a sphere in space), two give two possible points; another distance is needed to choose.
Exercise 32.12 ★★★
Africa’s mainland covers about 29 million and Greenland about 2.1 million . (a) How many times larger is Africa? (b) On a Mercator map, areas near the middle of Greenland, at about N, are enlarged about 10.5 times. Estimate the area Greenland seems to have. (c) Africa lies across the equator, where areas are enlarged little. Compare your answer to (b) with Africa’s area, and explain the wall map of the start of the chapter. (d) Which projection would you choose to show the sizes of the continents fairly?
Solution
Solution of Exercise 32.12.
(a) times. (b) million . (c) Greenland seems to cover about 22 million , close to Africa’s 29 million: on the Mercator wall map, the two look about the same size, although Africa is 14 times larger. (d) An equal-area projection.
32.7 Problem: A footpath across the Varden Hills
Problem 32.1
Weekend problem — planners have drawn a footpath across the Varden Hills on the topographic map; the final answer is the length of the footpath in kilometres and its total climb in metres
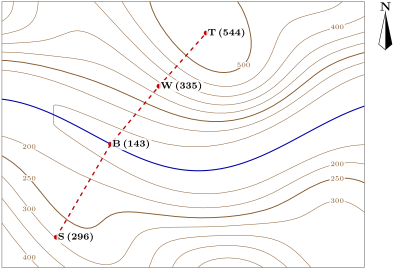
The footpath starts at a farm S, goes down to a bridge B over the river, then climbs to a shelter W and on to the summit T. Each leg is straight and only goes down or only goes up. The map is at ; the altitudes of S, B, W and T are written beside them.
Part I — The route on the map.
- At , how many metres on the ground does of the map stand for?
- On the original map, the leg S–B measures . How long is it on the ground, in kilometres?
- The legs B–W and W–T measure and . How long are they on the ground?
- In which general direction does the path run from B to T?
Part II — The climb.
- What is the contour interval of the map?
- Which leg goes down? By how many metres?
- By how many metres does the path climb on B–W, and on W–T?
- What is the average slope of the leg W–T, as a percentage?
- Why did the planners not draw the path in a straight line from S to T?
Part III — The walk.
- Suppose a walker covers an hour on the flat and needs one more minute for every of climb. How long does the whole walk take?
- Another walker follows the footpath the other way, from T to S. How many metres does she climb?
- What is the total length of the footpath, in kilometres, and its total climb, in metres?
Solution
Solution of Problem 32.1.
1. cm .
2. .
3. B–W: ; W–T: .
4. Towards the north-east.
5. .
6. S–B goes down: .
7. B–W: ; W–T: .
8. , about .
9. A straight line from S to T would cross the river where there is no bridge; the path goes down to the bridge at B.
10. at an hour: about 63 minutes; climb : about 40 minutes more. In all, about 1 h 43 min.
11. From T she goes down to B, then climbs from B up to S: .
12. Length: ; total climb: .